| |
 |
| Group Financial Highlights |
 |
| |
|
Restated* |
|
 |
| |
2003 |
2002 |
Change (%) |
 |
| For the year (S$’000) |
|
|
|
 |
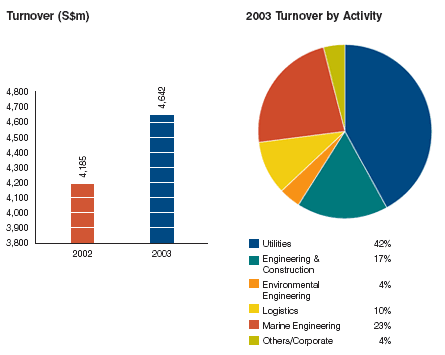
| Turnover |
4,641,660 |
4,184,573 |
11% |
 |
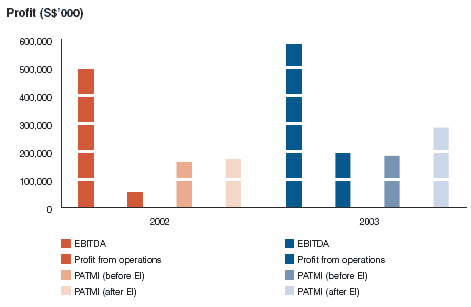
| EBITDA |
582,875 |
496,970 |
17% |
 |
| Profit from operations |
198,595 |
54,397 |
265% |
 |
| Profit after taxation and minority interest
(PATMI) |
|
|
|
 |
| -before exceptional items |
183,685 |
161,484 |
14% |
 |
| -after exceptional items |
285,135 |
171,554 |
66% |
 |
| |
|
|
|
 |
| At year end (S$’000) |
|
|
|
 |
| Shareholders’ funds |
1,715,676 |
1,503,675 |
14% |
 |
| Total assets |
6,622,114 |
6,006,373 |
10% |
 |
| Net borrowings |
1,374,277 |
1,333,164 |
3% |
 |
| |
|
|
|
 |
| Per share |
|
|
|
 |
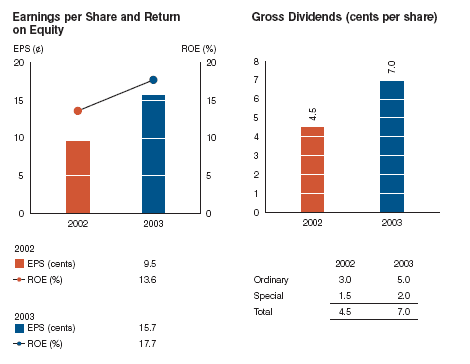
| Earnings (cents) |
|
|
|
 |
| -before exceptional items |
10.09 |
8.96 |
13% |
 |
| -after exceptional items |
15.66 |
9.52 |
65% |
 |
| Net tangible assets (cents) |
88.16 |
80.71 |
9% |
 |
| Gross dividends (cents) |
7.00 |
4.50 |
56% |
 |
| Gross dividend yield (%) |
5.6 |
5.7 |
-2% |
 |
| |
|
|
|
 |
| Financial ratios |
|
|
|
 |
| Return on equity (%) |
17.7 |
13.6 |
30% |
 |
| Return on total assets (%) |
7.3 |
5.4 |
35% |
 |
| Interest cover (times) |
7.4 |
5.3 |
38% |
 |
| Net gearing (times) |
0.6 |
0.6 |
0% |
 |
| Free cashflow (S$’000) |
530,424 |
811,000 |
-35% |
 |
| |
|
|
|
 |
| Productivity data (S$’000) |
|
|
|
 |
| Economic value added |
91,108 |
(90,121) |
201% |
 |
| Value added per employee |
80 |
68 |
19% |
 |
|
| * For 2002, figures have been
restated for the financial effects arising from
the accounting anomalies uncovered in SembLog India. |
| |
 |
| |
Overview
2003 was a year of growth for the Group. The Group
reported solid performance despite the difficult
operating environment and volatile market. Group
turnover and Profit After Tax and Minority Interest
(PATMI) were all significantly better than 2002.
PATMI grew by 66% on the back of strong contributions
from the organic growth of existing businesses,
new acquisitions, as well as divestment gains. |
| |
Turnover
Group turnover was S$4.6 billion, up from S$4.2
billion last year. Turnover from Utilities jumped
80% from 2002 with contributions from SembCorp Utilities
UK (formerly SembCorp Utilities Teesside), the United
Kingdom operations acquired in April 2003; higher
energy sales from SembCorp Cogen and SembCorp Power;
and Offshore Engineering’s progress on its
projects. Marine Engineering’s turnover rose
by 5% over 2002 with increased revenue from container
building and ship conversion jobs. Logistics’
turnover rose 8% driven by strong Supply Chain Management
performance in Singapore and China which grew by
10% and 14% respectively. Environmental Engineering’s
turnover also rose by 41% with contributions from
SembWaste Cleantech and SembEnviro Tay Paper acquired
in 2003.
The increases in turnover were reduced by lower
Engineering & Construction’s turnover
in line with the Group’s strategy to refocus
on process engineering, and divestments of food
distribution and building material businesses in
end 2002 and May 2003, respectively. |
| |
 |
| |
|
Earnings
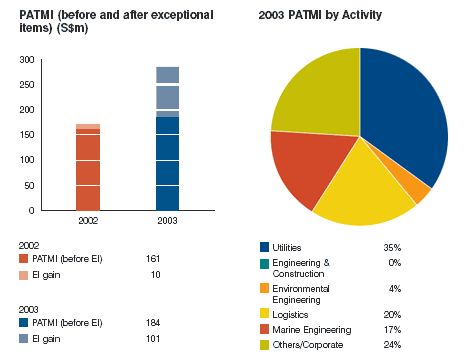
Group PATMI was S$285 million, up 66% from 2002,
an increase of S$113 million.
The main contributors are Utilities, Logistics
and Marine Engineering, which together contributed
to 72% of Group PATMI.
Utilities delivered an outstanding performance
in 2003, with PATMI growing by 81%. Core businesses
within Utilities, including its new United Kingdom
operation as well as the Energy business performed
strongly and contributed to the 81% growth in
PATMI from Utilities. The Offshore Engineering
division contributed about 18% of Utilities’
PATMI in 2003, despite keen competition.
Share of Logistics’ PATMI grew due to its
main earnings driver (Supply Chain Management
operation), strong contributions from Kuehne &
Nagel and foreign exchange gains.
Share of Marine Engineering’s PATMI was
lower at S$49 million as there was no exceptional
gain in 2003. Marine Engineering’s results
were also affected by postponement of repairs
as a result of high freight rates and SARS in
the first half of 2003 and keen competition. Marine
Engineering’s investments in Dalian and
Brazil have borne fruit and contributed positively
to its results.
The Group has also in 2003 achieved good results
from its various divestments. The Group reported
S$101 million gains from its divestments of heavy
infrastructure and theme park investments in China,
Pacific Internet, and building material businesses.
Capital Expenditure and Cashflow
A total of S$581 million was spent on fixed assets
(S$146 million) and investments (S$435 million)
in 2003. With these new investments, the Group’s
base of recurrent earnings has been strengthened.
Internally generated funds and divestments proceeds
were reallocated to fund these capital expenditure
and investments.
Free cashflow for 2003 was S$530 million.
 |
Financial Ratios
Earnings per share have risen to 15.7 cents in
2003 from 9.5 cents in 2002. Return on Equity
was 17.7%, which was higher than management’s
target of 12%. Return on Total Assets was 7.3%,
a 35% increase from 5.4% in 2002.
Interest cover was a healthy 7.4 times, an improvement
of 38% from 5.3 times. Including project finance
loans, our net gearing was 0.6 times, and excluding
project finance loans, our net gearing was 0.3
times at the end of 2003.
Dividend
A final dividend of 5.0 cents per share less tax
at 22% amounting to S$71.047 million on the existing
issued share capital, is proposed for the financial
year ended December 31, 2003. Together with the
special interim dividend of 2.0 cents per share
less tax of S$28.411 million which was paid in
2003, the total dividend payout for 2003 will
amount to 7.0 cents per share and S$99.458 million.
This represents an increase of 56% as compared
with 2002.
For 2002, a final dividend of 3.0 cents per share
and a special dividend of 1.5 cents per share
less tax amounting to a total of 4.5 cents per
share and S$63.924 million was declared and paid
in 2003.
 |
|
|
|
|
|
|
| |
|
|