|  | 
 Statistics of Shareholders as of March 16, 2004


                            | Authorised Share Capital: | 2,000,000,000 ordinary shares |   
                            | Issued and fully Paid-up Capital: | 1,822,058,564 ordinary shares |   
                            | Number of Shareholders: | 33,584 |   
                            | Class of Shares: | Ordinary Shares of S$0.25 each with equal voting 
                              rights |  Shareholdings held by the public
 Based on information available to the Company as of March 
                        16, 2004, 43.50 per cent of the issued ordinary shares 
                        of the Company is held by the public and therefore, Rule 
                        723 of the Listing Manual issued by SGX-ST is complied 
                        with.


                            |  |  |  |  |  |   
                            | Substantial 
                              Shareholders | Direct Interest | Indirect Interest | Total Interest | % |   
                            |  |   
                            |  |  |  |  |  |  |   
                            |  |   
                            | 1 | Temasek Holdings (Private) 
                              Limited* | 215,554,693 | 722,194,167 | 937,748,860 | 51.46 |   
                            |  |   
                            | 2 | Singapore Technologies 
                              Pte Ltd | 711,254,167 | 300,000 | 711,554,167 | 39.05 |   
                            |  |   
                            | 3 | Schroder Investment 
                              Management Group | - | 91,821,000 | 91,821,000 | 5.04 |   
                            |  |   
                            |  |  |  |  |  |  |  * Temasek is deemed to be interested 
                        in the 711,554,167 shares held by Singapore Technologies 
                        Pte Ltd as well as the balance of 10,640,000 shares held 
                        by its other subsidiaries.
 
 Top 20 Shareholders as of March 16, 2004
 
                          
                            | 
                                 
                                  |  |  |  |  |   
                                  | No |  | No. of shares 
                                    held | % |   
                                  |  |   
                                  |  |  |  |  |   
                                  |  |   
                                  | 1 | Singapore Technologies 
                                    Pte Ltd | 711,254,167 | 39.04 |   
                                  |  |   
                                  | 2 | Temasek Holdings 
                                    (Pte) Ltd | 215,554,693 | 11.83 |   
                                  |  |   
                                  | 3 | Raffles Nominees 
                                    Pte Ltd | 153,331,611 | 8.42 |   
                                  |  |   
                                  | 4 | DBS Nominees Pte 
                                    Ltd | 136,564,750 | 7.50 |   
                                  |  |   
                                  | 5 | Citibank Nominees 
                                    Singapore Pte Ltd | 82,379,674 | 4.52 |   
                                  |  |   
                                  | 6 | United Overseas 
                                    Bank Nominees Pte Ltd | 73,990,956 | 4.06 |   
                                  |  |   
                                  | 7 | HSBC (Singapore) 
                                    Nominees Pte Ltd | 54,839,354 | 3.01 |   
                                  |  |   
                                  | 8 | Oversea-Chinese 
                                    Bank Nominees Pte Ltd | 28,277,748 | 1.55 |   
                                  |  |   
                                  | 9 | DB Nominees (S) 
                                    Pte Ltd | 17,704,664 | 0.97 |   
                                  |  |   
                                  | 10 | Morgan Stanley 
                                    Asia (Singapore) | 11,131,367 | 0.61 |   
                                  |  |   
                                  | 11 | Capital Intelligence 
                                    Limited | 11,001,000 | 0.61 |   
                                  |  |   
                                  | 12 | Startree Investments 
                                    Pte Ltd | 10,000,000 | 0.55 |   
                                  |  |   
                                  | 13 | OCBC Securities 
                                    Private Ltd | 4,570,007 | 0.25 |   
                                  |  |   
                                  | 14 | UOB Kay Hian Pte 
                                    Ltd | 3,478,799 | 0.19 |   
                                  |  |   
                                  | 15 | Phillip Securities 
                                    Pte Ltd | 3,343,336 | 0.18 |   
                                  |  |   
                                  | 16 | G K Goh Stockbrokers 
                                    Pte Ltd | 3,339,718 | 0.18 |   
                                  |  |   
                                  | 17 | DBS Vickers Secs 
                                    (S) Pte Ltd | 3,150,289 | 0.17 |   
                                  |  |   
                                  | 18 | Citibank Consumer 
                                    Nominees Pte Ltd | 3,131,892 | 0.17 |   
                                  |  |   
                                  | 19 | The Asia Life 
                                    Assurance Society Ltd - Singapore Life Fund | 2,614,000 | 0.14 |   
                                  |  |   
                                  | 20 | Societe 
                                    Generale Singapore Branch | 2,298,000 | 0.13 |   
                                  |  |   
                                  |  |  | 1,531,956,025 | 84.07 |   
                                  |  |   
                                  |  |  |  |  |    |  
                            | 
                                 
                                  | Range of shareholdings | No. of shareholders | % | No. of shares | % |   
                                  |  |   
                                  |  |  |  |  |  |   
                                  | 1  999 | 1,719 | 5.12 | 703,446 | 0.04 |   
                                  |  |   
                                  | 1,000  10,000 | 26,563 | 79.09 | 99,668,305 | 5.47 |   
                                  |  |   
                                  | 10,001  
                                    1,000,000 | 5,275 | 15.71 | 179,727,104 | 9.86 |   
                                  |  |   
                                  | 1,000,001 and 
                                    above | 27 | 0.08 | 1,541,959,709 | 84.63 |   
                                  |  |   
                                  |  | 33,584 | 100.00 | 1,822,058,564 | 100.00 |   
                                  |  |   
                                  |  |  |  |  |  |  |  
 
 
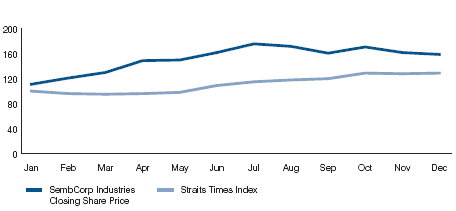
 Average Monthly SembCorp Industries Share Price and
 Straits Times Index (STI) in 2003


                            |  |   
                            | 
                                 
                                  |  |  |  |   
                                  | Month | Closing Share Price (S$) | ST Index |   
                                  | January | 0.87 | 1347.12 |   
                                  | February | 0.95 | 1291.85 |   
                                  | March | 1.02 | 1271.12 |   
                                  | April | 1.17 | 1284.92 |   
                                  | May | 1.18 | 1315.14 |   
                                  | June | 1.27 | 1457.49 |   
                                  | July | 1.38 | 1545.72 |   
                                  | August | 1.35 | 1582.20 |   
                                  | September | 1.27 | 1602.99 |   
                                  | October | 1.34 | 1729.58 |   
                                  | November | 1.27 | 1717.11 |   
                                  | December | 1.25 | 1729.39 |   
                                  |  |  |  |  |   
                            |  |   
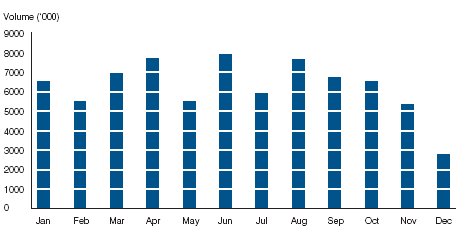
                            | Average Monthly Trade Volume of SembCorp Industries 
                              Shares in 2003 |   
                            |  |  
                            | 
                                 
                                  |  |  |   
                                  | Month | Volume ('000) |   
                                  | January | 6,525.32 |   
                                  | February | 5,511.56 |   
                                  | March | 7,064.30 |   
                                  | April | 7,697.09 |   
                                  | May | 5,523.10 |   
                                  | June | 7,965.10 |   
                                  | July | 5,952.83 |   
                                  | August | 7,644.43 |   
                                  | September | 6,747.64 |   
                                  | October | 6,542.95 |   
                                  | November | 5,371.05 |   
                                  | December | 2,789.00 |   
                                  |  |  |  |  
 Financial Calendar


                            | 2003 |  |   
                            |  |   
                            | Financial year-end | December 31, 2003 |   
                            |  |   
                            |  | Announcement of 1Q2003 results | May 12, 2003 |   
                            |  | Announcement of 2Q2003 results | August 11, 2003 |   
                            |  | Announcement of 3Q2003 results | November 11, 2003 |   
                            |  | Announcement of FY2003 results | February 11, 2004 |   
                            |  |  |  |   
                            | Despatch of Annual Report to shareholders | April 15, 2004 |   
                            | Annual General Meeting
 | April 30, 2004
 |   
                            |  | 2003 Proposed final dividend | 5 pm, 
                              May 6, 2004 |  
                            | Book closure date |   
                            |  | Payment date | May 21, 2004 |   
                            |  |  |  |   
                            | 2004 |  |   
                            |  |   
                            | Financial year-end | December 31, 2004 |   
                            |  |   
                            |  | Announcement of 1Q2004 results | May 2004 |   
                            |  | Announcement of 2Q2004 results | August 2004 |   
                            |  | Announcement of 3Q2004 results | November 2004 |   
                            |  | Announcement of FY2004 results | February 2005 |   
                            |  |  |  |      |  |