 |

OVERVIEW
During the year, we increased our turnover and Profit After Tax and
Minority Interests (PATMI), notwithstanding the difficult operating
environment in 2002.
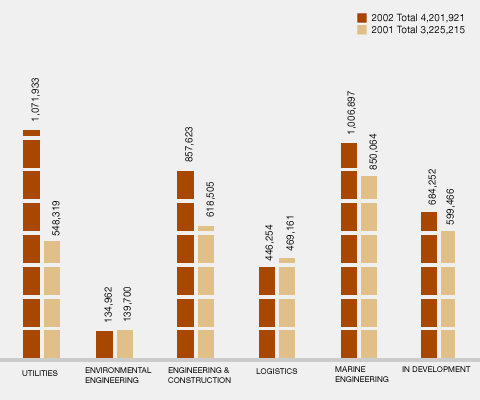
Turnover increased by 30 per cent or S$1.0 billion in 2002. Half of
this increase came from Utilities and a quarter came from SembCorp
Simon-Carves, a subsidiary of SembCorp Engineers and Constructors
(SembE&C).
Earnings Before Interest, Tax, Depreciation and Amortisation (EBITDA)
and PATMI grew by 5 per cent and 3 per cent respectively.
If not for the problems encountered in SembE&C relating to a deep
tunnel sewerage system project and a land reclamation project and
the one-time impairment loss on goodwill by an associate, Kuehne &
Nagel, the increase in PATMI would have been greater.
TURNOVER
Turnover in Utilities almost doubled in 2002 due to full year contributions
from SembCorp Cogen and SembCorp Power which became operational
in September 2001. Marine Engineering's turnover hit S$1.0 billion,
attributed mainly to increased revenue from newbuilding and ship
conversion jobs, while Engineering & Construction's turnover
increased due to a full year contribution from SembCorp Simon-Carves,
which was acquired in May 2001.
The increases in turnover in the various Key Businesses were offset
by a reduction
in turnover in Logistics due to the divestment of a major portion
of its marine services business and some investments in 2001.
Turnover from Singapore increased by 20 per cent to S$2.3 billion.
There was also substantial improvement in turnover contributed from
China, Europe and the United States.
TURNOVER BY ACTIVITY (S$’000)

TURNOVER BY ACTIVITY (S$’000)
 |
|
2002 |
% |
2001 |
% |
 |
| |
|
|
| |
Key Businesses |
|
 |
|
 |
|
| |
Utilities |
1,071,933 |
26 |
548,319 |
17 |
|
| |
Environmental Engineering |
134,962 |
3 |
139,700 |
4 |
|
| |
Engineering & Construction |
857,623 |
20 |
618,505 |
19 |
|
| |
Logistics |
446,254 |
11 |
469,161 |
15 |
|
| |
Marine Engineering |
1,006,897 |
24 |
850,064 |
26 |
|
| |
Sub-total for Key Businesses |
3,517,669 |
84 |
2,625,749 |
81 |
|
| |
|
|
|
|
|
|
| |
In Development |
|
|
|
|
|
| |
Food Processing & Distribution |
392,289 |
9 |
373,928 |
12 |
|
| |
Minting |
18,752 |
* |
20,843 |
1 |
|
| |
Industrial Parks |
103,369 |
3 |
84,588 |
3 |
|
| |
Building Materials |
77,799 |
2 |
72,334 |
2 |
|
| |
Properties, Financial Services, Hotels & Resorts |
88,255 |
2 |
46,843 |
1 |
|
| |
Corporate |
3,788 |
* |
930 |
* |
|
| |
Sub-total for In Development |
684,252 |
16 |
599,466 |
19 |
|
| |
|
|
|
|
|
|
| |
Total |
4,201,921 |
100 |
3,225,215 |
100 |
|
| |
|
|
|
|
|
|
| |
* less than
1% |
|
|
|
|
|
EARNINGS
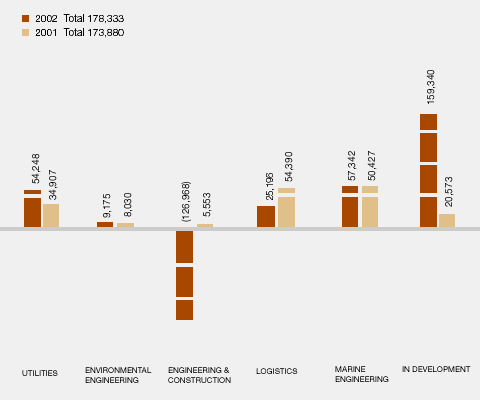
Contribution to PATMI came mainly from Utilities, Marine Engineering
and Logistics. Together they contributed 77 per cent to Group PATMI.
Utilities' PATMI registered a healthy growth of 55 per cent primarily
due to increased contributions from centralised utilities, offshore
engineering and SembCorp Gas.
SembCorp Cogen's performance was however adversely affected by the
high spinning reserve costs under the old electricity market rules.
Marine Engineering grew 14 per cent on the back of a healthy order
book in ship conversion, newbuilding and offshore; and was further
strengthened by a net exceptional gain arising from the sale of
Jurong Technologies Industrial Corporation.
Logistics‘ PATMI declined by 54% as a result of the extraordinary
goodwill amortisation taken up by Kuehne & Nagel. Excluding
exceptionals, Logistics recorded a growth of 30 per cent, primarily
due to growth in supply chain management. Joint marketing efforts
and process integration with its associate, Kuehne & Nagel,
have also borne fruit and brought in new contracts.
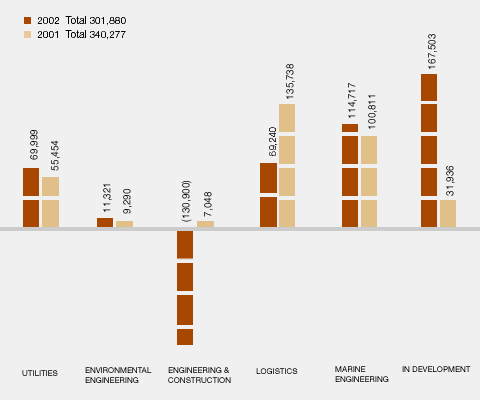
PROFIT BEFORE TAX BY ACTIVITY (S$’000)

PROFIT BEFORE TAX BY ACTIVITY (S$’000)
 |
|
2002 |
% |
2001 |
% |
 |
| |
|
|
| |
Key Businesses |
|
 |
|
 |
|
| |
Utilities |
69,999 |
23 |
55,454 |
16 |
|
| |
Environmental Engineering |
11,321 |
4 |
9,290 |
3 |
|
| |
Engineering & Construction |
(130,900) |
(43) |
7,048 |
2 |
|
| |
Logistics |
69,240 |
23 |
135,738 |
40 |
|
| |
Marine Engineering |
114,717 |
38 |
100,811 |
30 |
|
| |
Sub-total for Key Businesses |
134,377 |
45 |
308,341 |
91 |
|
| |
|
|
|
|
|
|
| |
In Development |
|
|
|
|
|
| |
Food Processing & Distribution |
39,803 |
13 |
38,883 |
11 |
|
| |
Minting |
3,167 |
1 |
2,913 |
1 |
|
| |
Industrial Parks |
5,696 |
2 |
8,363 |
3 |
|
| |
Internet Service Provider |
3,515 |
1 |
(1,595) |
* |
|
| |
IT Services |
654 |
* |
4,938 |
1 |
|
| |
Building Materials |
(13,175) |
(4) |
(1,781) |
(1) |
|
| |
Properties, Financial Services, Hotels & Resorts |
(19,563) |
(7) |
(2,587) |
(1) |
|
| |
Travel & Retail |
9 |
* |
3,730 |
1 |
|
| |
Others |
(8,886) |
(3) |
(1,229) |
* |
|
| |
Corporate |
156,283 |
52 |
(19,699) |
(6) |
|
| |
Sub-total for In Development |
167,503 |
55 |
31,936 |
9 |
|
| |
|
|
|
|
|
|
| |
Total |
301,880 |
100 |
340,277 |
100 |
|
|
| |
|
|
|
|
|
|
| |
* less than 1% |
|
|
|
|
|
Environmental Engineering's improved performance
was due to on-going restructuring and costs containment measures.
Engineering & Construction made a loss of S$127 million. Substantial
provisions for foreseeable losses relating to a deep tunnel sewerage
system project and a land reclamation project were made during the
year.
We also made impairment provisions of S$34 million for our properties
and investments in In Development.
During the year, we also sold off our non-core investments in Singapore
Food Industries and Singapore Computer Systems and realised profits
of S$168 million and S$23 million respectively.
SembCorp Industries continues to focus on its five Key Businesses
and sees strong contribution from its three Key Businesses namely
Utilities, Marine Engineering and Logistics.
PROFIT AFTER TAX AND MINORITY INTERESTS BY ACTIVITY (S$’000)

PROFIT AFTER TAX AND MINORITY INTERESTS BY ACTIVITY (S$’000)
| |
|
2002 |
% |
2001 |
% |
|
| |
|
|
 |
Key Businesses |
|
 |
|
 |
 |
| |
Utilities |
54,248 |
31 |
34,907 |
20 |
|
| |
Environmental Engineering |
9,175 |
5 |
8,030 |
5 |
|
| |
Engineering & Construction |
(126,968) |
(71) |
5,553 |
3 |
|
| |
Logistics |
25,196 |
14 |
54,390 |
31 |
|
| |
Marine Engineering |
57,342 |
32 |
50,427 |
29 |
|
| |
Sub-total for Key Businesses |
18,993 |
11 |
153,307 |
88 |
|
|
|
|
| |
|
|
|
|
|
|
| |
In Development |
|
|
|
|
|
| |
Food Processing & Distribution |
22,397 |
12 |
20,748 |
12 |
|
| |
Minting |
2,952 |
2 |
2,219 |
1 |
|
| |
Industrial Parks |
(132) |
* |
7,734 |
4 |
|
| |
Internet Service Provider |
2,140 |
1 |
(1,854) |
(1) |
|
| |
IT Services |
357 |
* |
3,515 |
2 |
|
| |
Building Materials |
(10,763) |
(6) |
28 |
* |
|
| |
Properties, Financial Services, Hotels & Resorts |
(19,714) |
(11) |
(2,659) |
(1) |
|
| |
Travel & Retail |
(79) |
* |
1,596 |
1 |
|
| |
Others |
(6,806) |
(4) |
(1,261) |
(1) |
|
| |
Corporate |
168,98 |
95 |
(9,493) |
(5) |
|
| |
Sub-total for In Development |
159,340 |
89 |
20,573 |
12 |
|
| |
|
|
|
|
|
|
| |
Total |
178,333 |
100 |
173,880 |
100 |
|
|
| |
|
|
|
|
|
|
| |
* less than
1% |
|
|
|
|
|
CAPITAL EXPENDITURE AND CASHFLOW
Of the total capital expenditure amounting to S$334 million in 2002,
we spent S$152 million on investments and S$182 million on fixed
assets.
During the year, cashflow from operating activities improved substantially
due to better collections from debtors and better creditor management.
The proceeds from the equity placement and divestments were used
to make substantial repayment of debt amounting to about S$0.9 billion.
 |
|
2002
S$m |
2001
S$m |
Increase/(Decrease)
S$m |
 |
| |
|
|
| |
Capital Expenditure: |
|
|
|
|
| |
Fixed Assets |
182.1 |
267.7 |
(85.6) |
|
| |
Investments |
152.0 |
176.9 |
(24.9) |
|
|
| |
|
|
|
|
|
FINANCIAL INDICATORS
Earnings Per Share (EPS) would have risen in accordance to
the increase in PATMI. However, as a result of the increase in share
capital, EPS fell from 10.83 cents to 9.89 cents. Return on Equity,
calculated on a much higher equity base was 14.0 per cent, which
was higher than the target of 12 per cent. Return on Total Assets
edged down slightly from 5.8 per cent to 5.6 per cent.
Net Tangible Assets Per Share increased by 37 per cent to 81 cents
due to the increase in capital, share premium and profits during
the year. Interest cover was a healthy 5.4 times.
With net debt reduced to only S$1.3 billion and total of shareholders'
funds and minority interests increased by S$0.5 billion to S$2.2
billion, our debt/equity ratio has been reduced substantially from
1.3 times in 2001 to only 0.6 times at the end of 2002. Excluding
project finance loans, our net gearing ratio came down to 0.4 times.
Our balance sheet has been significantly strengthened as at the
end of the year under review.
| |
|
2002 |
2001 |
Increase/(Decrease) |
|
|
|
|
| |
|
|
|

|
Shareholders' Funds (S$m) |
1,515.4 |
1,025.70 |
489.7 |
 |
| |
Return on Equity (%) |
14.0 |
18.5 |
(4.5) |
|
| |
Return on Total Assets (%) |
5.6 |
5.8 |
(0.2) |
|
| |
Net Tangible Assets Per Share (S$) |
0.81 |
0.59 |
0.22 |
|
| |
Earnings Per Share (cents) |
9.89 |
10.83 |
(0.94) |
|
| |
Interest Cover (times) |
5.4 |
5.4 |
— |
|
| |
Net Gearing (times) |
0.6 |
1.3 |
(0.7) |
|
| |
Economic Value Add (EVA™) (S$m) |
(80.5) |
(56.2) |
(24.3) |
|
| |
Weighted Average Cost of Capital (%) |
8.2 |
8.4 |
(0.2) |
|
| |
EVA attributable to shareholders (S$m) |
(39.0) |
(12.9) |
(26.1) |
|
| |
|
|
|
|
|
|
 |

|


|