| |
 |
 |
 |
 |
 |
 |
 |
 |
 |
 |
 |
 |
| For the year (S$ million) |
|
|
|
|
|
 |
 |
 |
 |
 |
 |
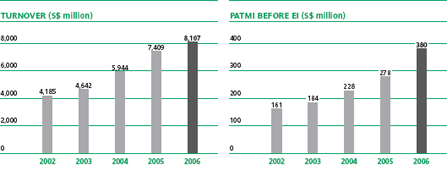
| Turnover |
4,185 |
4,642 |
5,944 |
7,409 |
8,107 |
 |
 |
 |
 |
 |
 |
| EBITDA |
473 |
559 |
1,088 |
633 |
1,207 |
 |
 |
 |
 |
 |
 |
| Profit before income tax expense |
291 |
471 |
982 |
508 |
1,149 |
 |
 |
 |
 |
 |
 |
| Profit attributable to Shareholders of the Company (PATMI): |
|
|
|
|
|
 |
 |
 |
 |
 |
 |
- |
before exceptional items |
|
161 |
184 |
228 |
278 |
380 |
 |
 |
 |
 |
 |
 |
- |
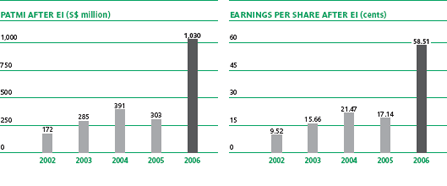
after exceptional items |
|
172 |
285 |
391 |
303 |
1,030 |
 |
 |
 |
 |
 |
 |
| |
|
|
|
|
|
 |
 |
 |
 |
 |
 |
| At year end (S$ million) |
|
|
|
|
|
 |
 |
 |
 |
 |
 |
| Property, plant and equipment |
2,164 |
2,514 |
2,492 |
2,627 |
2,535 |
 |
 |
 |
 |
 |
 |
| Other non-current assets |
1,421 |
1,414 |
1,220 |
1,171 |
1,316 |
 |
 |
 |
 |
 |
 |
| Net current assets |
79 |
51 |
245 |
305 |
1,149 |
 |
 |
 |
 |
 |
 |
| Non-current liabilities |
(1,525) |
(1,595) |
(1,156) |
(1,258) |
(1,540) |
 |
 |
 |
 |
 |
 |
 |
 |
 |
 |
 |
 |
| Net assets |
2,139 |
2,384 |
2,801 |
2,845 |
3,460 |
 |
 |
 |
 |
 |
 |
 |
 |
 |
 |
 |
 |
| Share capital and reserves |
1,504 |
1,716 |
1,958 |
2,000 |
2,812 |
 |
 |
 |
 |
 |
 |
| Minority interests |
635 |
668 |
843 |
845 |
648 |
 |
 |
 |
 |
 |
 |
 |
 |
 |
 |
 |
 |
| Total Equity |
2,139 |
2,384 |
2,801 |
2,845 |
3,460 |
 |
 |
 |
 |
 |
 |
 |
 |
 |
 |
 |
 |
| |
|
|
|
|
|
 |
 |
 |
 |
 |
 |
| Per share |
|
|
|
|
|
 |
 |
 |
 |
 |
 |
| Earnings (cents) |
|
|
|
|
|
 |
 |
 |
 |
 |
 |
- |
before exceptional items |
|
8.96 |
10.09 |
12.49 |
15.74 |
21.57 |
 |
 |
 |
 |
 |
 |
- |
after exceptional items |
|
9.52 |
15.66 |
21.47 |
17.14 |
58.51 |
 |
 |
 |
 |
 |
 |
| Net tangible assets (cents) |
80.71 |
88.16 |
98.69 |
105.74 |
152.18 |
 |
 |
 |
 |
 |
 |
| Gross dividend (cents) |
4.50 |
7.00 |
11.25 |
6.50 |
28.90 |
 |
 |
 |
 |
 |
 |
| Gross dividend yield (%) * |
5.70 |
5.60 |
6.90 |
2.40 |
7.50 |
 |
 |
 |
 |
 |
 |
| |
|
|
|
|
|
 |
 |
 |
 |
 |
 |
| Financial ratios |
|
|
|
|
|
 |
 |
 |
 |
 |
 |
| Return on equity (%) |
13.6 |
17.7 |
21.1 |
15.3 |
42.8 |
 |
 |
 |
 |
 |
 |
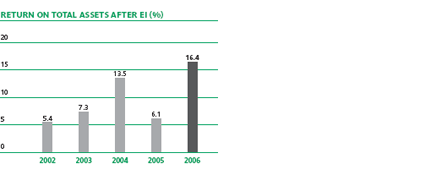
| Return on total assets (%) |
5.4 |
7.3 |
13.5 |
6.1 |
16.4 |
 |
 |
 |
 |
 |
 |
| Interest cover (times) |
5.0 |
7.1 |
14.5 |
11.7 |
22.4 |
 |
 |
 |
 |
 |
 |
| Net gearing (times) |
0.6 |
0.6 |
Net Cash |
Net Cash |
0.04 |
 |
 |
 |
 |
 |
 |
 |
 |
 |
 |
 |
 |
| |
|
|
|
|
|
|
| * Based on the closing share price for respective years. |
| |
 |
 |
 |
| |
|
| |
 |
 |
 |
 |
 |
 |
 |
 |
 |
 |
 |
 |
| Average staff strength |
13,168 |
12,430 |
13,301 |
14,862 |
13,199 |
 |
 |
 |
 |
 |
 |
| Employment costs (S$ million) |
579 |
540 |
573 |
621 |
624 |
 |
 |
 |
 |
 |
 |
| Sales per employee (S$’000) |
318 |
373 |
447 |
491 |
612 |
 |
 |
 |
 |
 |
 |
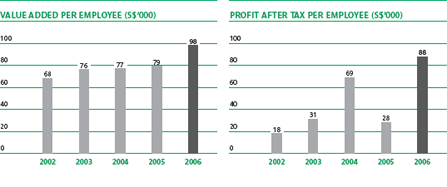
| Profit after tax per employee (S$’000) |
18 |
31 |
69 |
28 |
88 |
 |
 |
 |
 |
 |
 |
| |
|
|
|
|
|
 |
 |
 |
 |
 |
 |
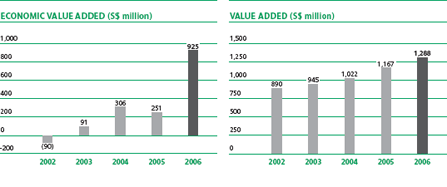
| Economic Value Added (S$ million) |
(90) |
91 |
306 |
251 |
925 |
 |
 |
 |
 |
 |
 |
| Economic Value Added spread (%) |
(1.7) |
1.8 |
5.6 |
4.8 |
19.2 |
 |
 |
 |
 |
 |
 |
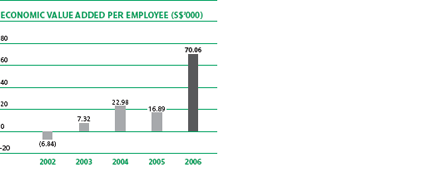
| Economic Value Added per employee (S$’000) |
(6.84) |
7.32 |
22.98 |
16.89 |
70.06 |
 |
 |
 |
 |
 |
 |
| |
|
|
|
|
|
 |
 |
 |
 |
 |
 |
| Value added (S$ million) |
890 |
945 |
1,022 |
1,167 |
1,288 |
 |
 |
 |
 |
 |
 |
| Value added per employee (S$’000) |
68 |
76 |
77 |
79 |
98 |
 |
 |
 |
 |
 |
 |
| Value added per employment costs (S$) |
1.54 |
1.75 |
1.79 |
1.88 |
2.06 |
 |
 |
 |
 |
 |
 |
| Value added per dollar investment in fixed assets (S$) |
0.32 |
0.27 |
0.29 |
0.3 |
0.35 |
 |
 |
 |
 |
 |
 |
| Value added per dollar sales (S$) |
0.22 |
0.21 |
0.17 |
0.16 |
0.16 |
 |
 |
 |
 |
 |
 |
| |
|
|
|
|
|
|
| |
 |
 |
 |
| |
 |
 |
 |
 |
 |
 |
 |
 |
 |
 |
 |
| |
|
|
|
|
|
|
|
|
|
|
 |
 |
 |
 |
 |
 |
 |
 |
 |
 |
 |
| Turnover by Activity |
 |
 |
 |
 |
 |
 |
 |
 |
 |
 |
 |
| |
|
|
|
|
|
|
|
|
|
|
 |
 |
 |
 |
 |
 |
 |
 |
 |
 |
 |
| Continuing operations: |
 |
 |
 |
 |
 |
 |
 |
 |
 |
 |
 |
| Utilities |
1,072 |
26 |
1,933 |
42 |
2,909 |
49 |
3,262 |
44 |
3,590 |
44 |
 |
 |
 |
 |
 |
 |
 |
 |
 |
 |
 |
| Marine & Offshore Engineering |
1,007 |
24 |
1,062 |
23 |
1,351 |
23 |
2,102 |
28 |
3,539 |
43 |
 |
 |
 |
 |
 |
 |
 |
 |
 |
 |
 |
| Environmental Management |
135 |
3 |
190 |
4 |
200 |
3 |
217 |
3 |
210 |
3 |
 |
 |
 |
 |
 |
 |
 |
 |
 |
 |
 |
| Others/Corporate |
684 |
16 |
189 |
4 |
161 |
3 |
190 |
3 |
147 |
2 |
 |
 |
 |
 |
 |
 |
 |
 |
 |
 |
 |
 |
 |
 |
 |
 |
 |
 |
 |
 |
 |
 |
| |
2,898 |
69 |
3,374 |
73 |
4,621 |
78 |
5,771 |
78 |
7,486 |
92 |
 |
 |
 |
 |
 |
 |
 |
 |
 |
 |
 |
| |
|
|
|
|
|
|
|
|
|
|
 |
 |
 |
 |
 |
 |
 |
 |
 |
 |
 |
| Discontinued operations: |
 |
 |
 |
 |
 |
 |
 |
 |
 |
 |
 |
| Logistics |
429 |
10 |
465 |
10 |
500 |
8 |
542 |
7 |
133 |
2 |
 |
 |
 |
 |
 |
 |
 |
 |
 |
 |
 |
| Engineering & Construction |
858 |
21 |
803 |
17 |
823 |
14 |
1,096 |
15 |
488 |
6 |
 |
 |
 |
 |
 |
 |
 |
 |
 |
 |
 |
 |
 |
 |
 |
 |
 |
 |
 |
 |
 |
 |
| Total |
4,185 |
100 |
4,642 |
100 |
5,944 |
100 |
7,409 |
100 |
8,107 |
100 |
 |
 |
 |
 |
 |
 |
 |
 |
 |
 |
 |
 |
 |
 |
 |
 |
 |
 |
 |
 |
 |
 |
| |
|
|
|
|
|
|
|
|
|
|
 |
 |
 |
 |
 |
 |
 |
 |
 |
 |
 |
| Profit attributable to Shareholders of the Company (PATMI) by Activity |
 |
 |
 |
 |
 |
 |
 |
 |
 |
 |
 |
| |
|
|
|
|
|
|
|
|
|
|
 |
 |
 |
 |
 |
 |
 |
 |
 |
 |
 |
| Continuing operations: |
 |
 |
 |
 |
 |
 |
 |
 |
 |
 |
 |
| Utilities |
54 |
31 |
98 |
35 |
108 |
28 |
147 |
49 |
223 |
22 |
 |
 |
 |
 |
 |
 |
 |
 |
 |
 |
 |
| Marine & Offshore Engineering |
53 |
31 |
49 |
17 |
60 |
15 |
73 |
24 |
129 |
12 |
 |
 |
 |
 |
 |
 |
 |
 |
 |
 |
 |
| Environmental Management |
9 |
5 |
13 |
4 |
14 |
4 |
5 |
2 |
(18) |
(2) |
 |
 |
 |
 |
 |
 |
 |
 |
 |
 |
 |
| Others/Corporate |
3 |
2 |
(33) |
(11) |
(19) |
(5) |
19 |
6 |
38 |
4 |
 |
 |
 |
 |
 |
 |
 |
 |
 |
 |
 |
 |
 |
 |
 |
 |
 |
 |
 |
 |
 |
 |
| |
119 |
69 |
127 |
45 |
163 |
42 |
244 |
81 |
372 |
36 |
 |
 |
 |
 |
 |
 |
 |
 |
 |
 |
 |
| Discontinued operations: |
 |
 |
 |
 |
 |
 |
 |
 |
 |
 |
 |
| Logistics |
41 |
24 |
56 |
20 |
64 |
16 |
33 |
11 |
8 |
1 |
 |
 |
 |
 |
 |
 |
 |
 |
 |
 |
 |
| Engineering & Construction |
1 |
1 |
1 |
0 |
1 |
0 |
1 |
0 |
(0) |
(0) |
 |
 |
 |
 |
 |
 |
 |
 |
 |
 |
 |
 |
 |
 |
 |
 |
 |
 |
 |
 |
 |
 |
| |
161 |
94 |
184 |
65 |
228 |
58 |
278 |
92 |
380 |
37 |
 |
 |
 |
 |
 |
 |
 |
 |
 |
 |
 |
| Exceptional items |
11 |
6 |
101 |
35 |
163 |
42 |
25 |
8 |
650 |
63 |
 |
 |
 |
 |
 |
 |
 |
 |
 |
 |
 |
 |
 |
 |
 |
 |
 |
 |
 |
 |
 |
 |
| Total |
172 |
100 |
285 |
100 |
391 |
100 |
303 |
100 |
1,030 |
100 |
 |
 |
 |
 |
 |
 |
 |
 |
 |
 |
 |
 |
 |
 |
 |
 |
 |
 |
 |
 |
 |
 |
| |
|
|
|
|
|
|
|
|
|
|
|
| |
 |
 |
 |
 |
 |
 |
 |
 |
 |
 |
 |
 |
| Value added from |
|
|
|
|
|
 |
 |
 |
 |
 |
 |
| Turnover |
3,997 |
4,565 |
5,867 |
7,304 |
8,074 |
 |
 |
 |
 |
 |
 |
| Less: bought in materials and services |
(3,107) |
(3,620) |
(4,845) |
(6,137) |
(6,786) |
 |
 |
 |
 |
 |
 |
 |
 |
 |
 |
 |
 |
| Gross value added |
890 |
945 |
1,022 |
1,167 |
1,288 |
 |
 |
 |
 |
 |
 |
| |
|
|
|
|
|
 |
 |
 |
 |
 |
 |
| Investment, interest and other income |
311 |
266 |
1,264 |
240 |
778 |
 |
 |
 |
 |
 |
 |
| Share of associates’ profit |
26 |
108 |
121 |
53 |
87 |
 |
 |
 |
 |
 |
 |
| Share of joint ventures’ profit |
37 |
37 |
35 |
48 |
53 |
 |
 |
 |
 |
 |
 |
| Other non-operating expenses |
(59) |
(41) |
(554) |
(74) |
(172) |
 |
 |
 |
 |
 |
 |
 |
 |
 |
 |
 |
 |
| |
1,205 |
1,315 |
1,888 |
1,434 |
2,034 |
 |
 |
 |
 |
 |
 |
 |
 |
 |
 |
 |
 |
| |
|
|
|
|
|
 |
 |
 |
 |
 |
 |
| Distribution |
|
|
|
|
|
 |
 |
 |
 |
 |
 |
| To employees in wages, salaries and benefits |
579 |
540 |
573 |
621 |
624 |
 |
 |
 |
 |
 |
 |
| To government in income and other taxes |
66 |
103 |
110 |
137 |
36 |
 |
 |
 |
 |
 |
 |
| To providers of capital on: |
|
|
|
|
|
 |
 |
 |
 |
 |
 |
| Interest paid on borrowings |
76 |
72 |
73 |
54 |
53 |
 |
 |
 |
 |
 |
 |
| Dividends to shareholders |
43 |
28 |
91 |
73 |
91 |
 |
 |
 |
 |
 |
 |
 |
 |
 |
 |
 |
 |
| |
764 |
743 |
847 |
885 |
804 |
 |
 |
 |
 |
 |
 |
 |
 |
 |
 |
 |
 |
| |
|
|
|
|
|
 |
 |
 |
 |
 |
 |
| Retained in Business |
|
|
|
|
|
 |
 |
 |
 |
 |
 |
| Depreciation and amortisation |
168 |
164 |
170 |
174 |
163 |
 |
 |
 |
 |
 |
 |
| Retained profits |
153 |
270 |
302 |
235 |
909 |
 |
 |
 |
 |
 |
 |
| Minority interests |
88 |
97 |
526 |
112 |
130 |
 |
 |
 |
 |
 |
 |
 |
 |
 |
 |
 |
 |
| |
409 |
531 |
998 |
521 |
1,202 |
 |
 |
 |
 |
 |
 |
| |
|
|
|
|
|
 |
 |
 |
 |
 |
 |
| Other non-operating expenses |
32 |
41 |
43 |
28 |
28 |
 |
 |
 |
 |
 |
 |
 |
 |
 |
 |
 |
 |
| |
441 |
572 |
1,041 |
549 |
1,230 |
 |
 |
 |
 |
 |
 |
 |
 |
 |
 |
 |
 |
| |
|
|
|
|
|
 |
 |
 |
 |
 |
 |
| Total Distribution |
1,205 |
1,315 |
1,888 |
1,434 |
2,034 |
 |
 |
 |
 |
 |
 |
 |
 |
 |
 |
 |
 |
| |
|
|
|
|
|
|
| The figures above reflect core businesses only. |
| |
| |
|
|
|
|