| |
| |
 |
| |
| |
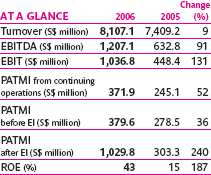
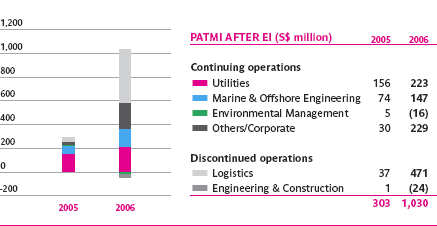
The Group achieved a robust performance, posting a record profit after tax and minority interest (PATMI) of S$1.03 billion for 2006, a growth of 240% over the previous year. Turnover from continuing operations increased by 30% to S$7.5 billion. PATMI before exceptional items (EI) from continuing operations rose by 52% to S$371.9 million.
The Group recorded exceptional gains of S$650.2 million for 2006. These comprised the net gain on the sale of subsidiaries and other financial assets, tax benefits relating to the compensation and related legal costs incurred in the Solitaire arbitration and write back of impairment for property, plant and equipment. These were partially offset by an additional charge arising from the final settlement of the Solitaire legal case and loss from the sale of a subsidiary. |
| |
| |
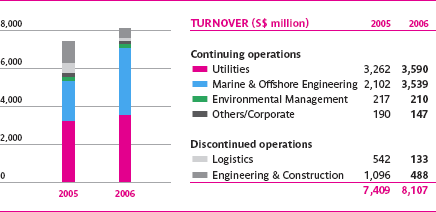
The Utilities and Marine & Offshore Engineering business units together contributed 95% of Group turnover from continuing operations of S$7.5 billion in 2006. Turnover from overseas businesses increased by 32% to S$4.0 billion, accounting for 54% of Group turnover in 2006.
Utilities' turnover increased by 10% to S$3.6 billion. Its Singapore and UK operations continued to do well, as prices for high sulphur fuel oil and power remained high.
Turnover for Marine & Offshore Engineering increased by 68% to S$3.5 billion. This was mainly due to strong growth in its rig building and ship repair businesses.
The decrease in turnover for Others/Corporate segment was due to the disposal of Nirwana Gardens Resort in 2006 and the enbloc sales of the Cairnhill properties in 2005. |
| |
 |
| |
| |
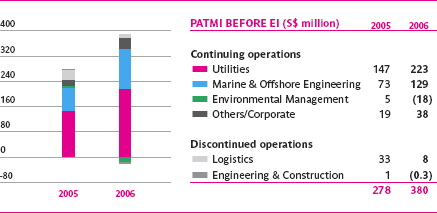
The Group achieved a strong growth of 36% in PATMI before exceptional items, driven mainly by the Utilities and Marine & Offshore Engineering business units. Our Environmental Management business unit recorded a loss for the year.
Utilities' PATMI before exceptional items in 2006 was higher by 52% over 2005, primarily due to strong performance from its UK operations and positive contribution from its former Offshore Engineering unit. The company took over the operations of the Fujairah water and power plant in the UAE in September 2006. Utilities also divested its Offshore Engineering unit and recorded a gain on sale amounting to S$8.0 million. However, the performance of its Singapore operations was impacted by an extended major inspection and repair of a gas turbine in its cogeneration plant.
The Group's share of the increased PATMI of the Marine & Offshore Engineering business unit was due to higher operating margins from the unit's rig building and ship repair businesses, gain on sale of investments as well as better contribution from its associates.
The poor performance by Environmental Management in 2006 was due to an impairment made for plant and equipment and a provision for contracts relating to the Singapore municipal waste collection sector.
The improvement in Others/Corporate PATMI in 2006 was due to the share of increased profit from associates and joint ventures in our industrial parks business, write back of provision on recovery of a loan and higher dividend income received from investments. |
| |
 |
 |
| |
| |
As at December 31, 2006, the Group had cash and cash equivalents of S$1.2 billion.
Excluding the payment for the Solitaire settlement of S$682.7 million, net cash from operating activities was S$596.5 million for 2006 as compared to S$848.3 million for 2005. The decrease was attributed to the changes in working capital, as more projects were undertaken by Marine & Offshore Engineering.
Net cash inflow from investing activities for 2006 was S$86.3 million. The Group realised S$863.1 million from the sale of investments. These included the sale of SembCorp Logistics Ltd, SembCorp Engineers and Constructors Pte Ltd, PT Batamindo Investment Cakrawala, PT Bintan Inti Industrial Estate and some COSCO Corporation (S) Ltd shares. The Group spent S$880.3 million on acquisition, expansion and operational capital expenditure. These included investments in Gallant Venture Ltd and COSCO Corporation (S) Ltd.
Net cash outflow from financing activities for 2005 related mainly to the payment made by the Company and its subsidiary, SembCorp Logistics Ltd, for the special interim dividend and capital reduction exercise. The Group also reduced its external borrowings.
Free cash flow, defined as operating cash flow plus investing cash flow adjusted for the expansion capital expenditure, was S$460.9 million as at December 31, 2006. The free cash flow was lower than 2005 due to the payment of the Solitaire settlement in 2006. |
| |
| |
Group shareholders' funds increased from S$2.0 billion at December 31, 2005 to S$2.8 billion at December 31, 2006. The increase was due to retained profits for the year and fair value adjustments for other financial assets partially offset by the capital distribution paid to shareholders.
The increase in share capital was due to the transfer of share premium account to the share capital, arising from the amendments in the Companies (Amendment) Act 2005, reduced by the capital distribution paid to shareholders. The decrease in minority interests was due to the sale of SembCorp Logistics Ltd.
The increase in interests in associates and the corresponding decrease in interests in joint ventures was mainly due to the Group's rationalisation of its Riau investments (previously held under joint ventures) through the consolidation of these investments under Gallant Venture Ltd, an associate listed on the Singapore Exchange. The increase in other financial assets was mainly due to the additional investment and fair value adjustments for COSCO Corporation (S) Ltd shares held by SembCorp Marine Ltd.
Inventories and work-in-progress increased due to more rig building and conversion projects undertaken by Marine & Offshore Engineering. Provisions decreased as the Group made payment for the full and final settlement of the Solitaire arbitration. |
| |
 |
| |
| |
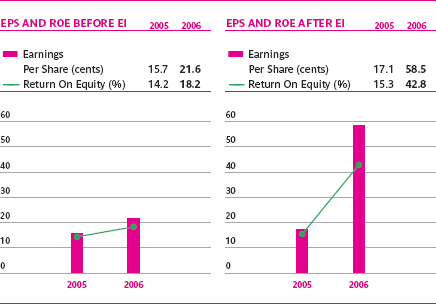
Excluding the exceptional items, return on equity improved to 18.2% in 2006 from 14.2% in 2005, and earnings per share increased to 21.6 cents in 2006 from 15.7 cents in 2005.
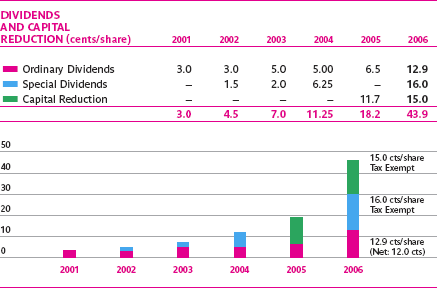
Arising from the sale of SembCorp Logistics Ltd, the Company paid a capital distribution of 15.0 cents per share in cash (without deduction for tax) out of the Company's share capital account. The cash distribution of S$264.6 million was paid on August 22, 2006.
Subject to the approval by the shareholders at the next annual general meeting, a final dividend of 28.9 cents per ordinary share (net: 28.0 cents) has been proposed for the financial year ended December 31, 2006. This comprises a 12.9 cents per share ordinary dividend (net: 12.0 cents), representing a payout of 56% of net profit from operations, and a 16.0 cents per share special 1-tier dividend. The special dividend together with the 15.0 cents per share capital distribution (tax exempt) paid in August 2006 accounts for a payout of 84% from exceptional items. Including the capital distribution, the total payout amounts to S$760.2 million or 74% of the PATMI for 2006. This represents a dividend yield of 11.4% based on the closing share price of S$3.84 on December 29, 2006. |
| |
 |
| |
| |
The financial statements are prepared in accordance with the Singapore Financial Reporting Standards (FRS).
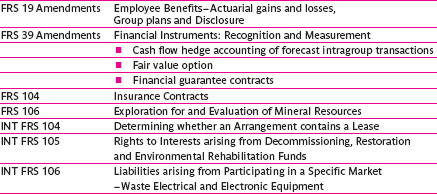
With effect from January 1, 2006, the Group adopted the following FRS and Interpretations to FRS (INT FRS), which are relevant to the Group's operations: |
| |
 |
| |
The effects of the adoption of the FRS and INT FRS did not result in substantial changes to the Group's accounting policies and did not give rise to any adjustments to the opening balances of accumulated profits of the prior and current years or changes to comparatives.
The following are two critical accounting policies that form the basis upon which the financial statements are prepared: |
| |
| Revenue recognition |
| Revenue on goods sold is recognised when the significant risks and rewards of ownership have been transferred to the buyer. Revenue from repair work, engineering, overhaul, service work, and marine and civil construction contracts is recognised based on the percentage of completion method. The stage of completion is assessed by reference to surveys of work performed or by reference to the percentage of costs incurred to date to the estimated total costs for each contract, with due consideration made to include only those costs that reflect work performed. Revenue on other service work is recognised when the work is completed. Revenue on sale of electricity and gases is billed and recognised upon delivery. |
| |
| Impairment of assets |
The recoverability or realisable value of the Group's assets is assessed in accordance with the various FRS. The carrying amounts of the Group's assets are reviewed at each balance sheet date to determine whether there is any indication of impairment. If any such indication exists, the assets' recoverable amounts are estimated. An impairment loss is recognised whenever the carrying amount of an asset or its cash-generating unit exceeds its recoverable amount.
Goodwill and intangible assets with indefinite useful lives are tested for impairment annually and as and when indicators of impairment occur.
The rest of the significant accounting policies are set out in Note 2 in the Notes to the Financial Statements on page 118. |
| |
 |
| |
| |
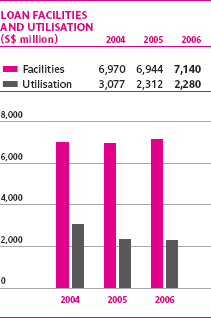
| The Group consolidates and diversifies its sources of funding by building on existing bilateral banking relationships and developing new ones. The Group also accesses capital markets as and when appropriate. The Group maintained a 70:30 ratio for its sources of funding from bilateral banking facilities and capital market access. Available credit facilities amounted to S$4.9 billion (2005: S$4.6 billion) with unfunded facilities lower at S$2.3 billion (2005: S$2.7 billion), due to the disposal of a subsidiary. |
| |
| |
Our focus is on maintaining an efficient and optimal mix of committed and uncommitted facilities and fixed and floating rate borrowings. The Group remains committed to adhering to prudent financial ratios and reducing the cost of funding. As at December 31, 2006, gross borrowings amounted to S$1.3 billion of which 87% (2005: 90%) was committed funding. Of the overall debt portfolio, 56% (2005: 61%) was not exposed to interest rate fluctuations. The Group seeks to limit its interest rate exposure by adopting a prudent debt structure while balancing this with funding cost considerations. The weighted average cost of funding was higher at 3.9% (2005: 3.4%), due to a rising interest rate environment. Interest cover ratio remained healthy at 22.4 times (2005: 11.7 times).
The current maturity profile of the Group's debt continues to favour the longer dated maturities, which reduces the impact of refinancing risk. As at end 2006, the portion of Group debt maturing within one year was 16%, to allow for maximum flexibility to pay down short-term debts with available cash. |
| |
 |
| |
| |
| The Group's financing and treasury activities continue to be mainly centralised within SembCorp Financial Services (SFS), the funding vehicle of the Group. SFS on-lends funds borrowed by it to companies within the Group. SFS also actively manages the cash within the Group by taking in surplus funds from those with excess cash and lending to those with funding requirements. Such proactive cash management continues to be an efficient and cost-effective way of financing the Group's requirements. |
| |
| |
|
2006
S$ million |
% |
2005
S$ million |
% |
2004
S$ million |
% |
 |
 |
 |
 |
 |
 |
 |
| Source of funding |
|
|
|
|
|
|
 |
 |
 |
 |
 |
 |
 |
| Funded bank facilities, capital markets and available funds |
|
|
|
|
|
|
 |
 |
 |
 |
 |
 |
 |
| Funded facilities available for drawdown |
4,791 |
|
4,277 |
|
4,664 |
|
 |
 |
 |
 |
 |
 |
 |
| Cash and cash equivalents |
1,186 |
|
1,231 |
|
2,100 |
|
 |
 |
 |
 |
 |
 |
 |
 |
 |
 |
 |
 |
 |
 |
| Total facilities and available funds |
5,977 |
|
5,508 |
|
6,764 |
|
 |
 |
 |
 |
 |
 |
 |
| Amount drawn down |
1,310 |
|
1,077 |
|
1,788 |
|
 |
 |
 |
 |
 |
 |
 |
 |
 |
 |
 |
 |
 |
 |
| Unutilised funded facilities and funds available |
4,667 |
|
4,431 |
|
4,976 |
|
 |
 |
 |
 |
 |
 |
 |
| |
|
|
|
|
|
|
 |
 |
 |
 |
 |
 |
 |
| Unfunded bank facilities |
|
|
|
|
|
|
 |
 |
 |
 |
 |
 |
 |
| Unfunded facilities available for drawdown |
2,349 |
|
2,667 |
|
2,306 |
|
 |
 |
 |
 |
 |
 |
 |
| Amount drawn down |
970 |
|
1,235 |
|
1,289 |
|
 |
 |
 |
 |
 |
 |
 |
 |
 |
 |
 |
 |
 |
 |
| Unutilised unfunded facilities available |
1,379 |
|
1,432 |
|
1,017 |
|
 |
 |
 |
 |
 |
 |
 |
| |
|
|
|
|
|
|
 |
 |
 |
 |
 |
 |
 |
Total unutilised facilities and
funds available |
6,046 |
|
5,863 |
|
5,993 |
|
 |
 |
 |
 |
 |
 |
 |
 |
 |
 |
 |
 |
 |
 |
| |
|
|
|
|
|
|
 |
 |
 |
 |
 |
 |
 |
| Committed facilities |
|
|
|
|
|
|
 |
 |
 |
 |
 |
 |
 |
| Committed facilities available |
1,151 |
|
997 |
|
1,381 |
|
 |
 |
 |
 |
 |
 |
 |
| Amount drawn |
1,151 |
87 |
997 |
90 |
1,281 |
67 |
 |
 |
 |
 |
 |
 |
 |
| |
|
|
|
|
|
|
 |
 |
 |
 |
 |
 |
 |
| Funding profile |
|
|
|
|
|
|
 |
 |
 |
 |
 |
 |
 |
| Maturity profile |
|
|
|
|
|
|
 |
 |
 |
 |
 |
 |
 |
| Due within one year |
219 |
16 |
185 |
17 |
1,031 |
54 |
 |
 |
 |
 |
 |
 |
 |
| Due between one to five years |
816 |
62 |
681 |
61 |
618 |
32 |
 |
 |
 |
 |
 |
 |
 |
| Due after five years |
288 |
22 |
240 |
22 |
257 |
14 |
 |
 |
 |
 |
 |
 |
 |
 |
 |
 |
 |
 |
 |
 |
| |
1,323 |
100 |
1,106 |
100 |
1,906 |
100 |
 |
 |
 |
 |
 |
 |
 |
 |
 |
 |
 |
 |
 |
 |
| |
|
|
|
|
|
|
 |
 |
 |
 |
 |
 |
 |
| Debt mix |
|
|
|
|
|
|
 |
 |
 |
 |
 |
 |
 |
| Floating rate debt |
577 |
44 |
436 |
39 |
778 |
41 |
 |
 |
 |
 |
 |
 |
 |
| Fixed rate debt |
746 |
56 |
670 |
61 |
1,128 |
59 |
 |
 |
 |
 |
 |
 |
 |
 |
 |
 |
 |
 |
 |
 |
| |
1,323 |
100 |
1,106 |
100 |
1,906 |
100 |
 |
 |
 |
 |
 |
 |
 |
 |
 |
 |
 |
 |
 |
 |
| |
|
|
|
|
|
|
 |
 |
 |
 |
 |
 |
 |
Currency denomination
of debt |
|
|
|
|
|
|
 |
 |
 |
 |
 |
 |
 |
| SGD |
1,014 |
77 |
829 |
75 |
1,510 |
79 |
 |
 |
 |
 |
 |
 |
 |
| USD |
32 |
2 |
24 |
2 |
118 |
6 |
 |
 |
 |
 |
 |
 |
 |
| GBP |
257 |
19 |
209 |
19 |
212 |
11 |
 |
 |
 |
 |
 |
 |
 |
| Others |
20 |
2 |
45 |
4 |
65 |
4 |
 |
 |
 |
 |
 |
 |
 |
 |
 |
 |
 |
 |
 |
 |
| |
1,323 |
100 |
1,106 |
100 |
1,906 |
100 |
 |
 |
 |
 |
 |
 |
 |
 |
 |
 |
 |
 |
 |
 |
| |
|
|
|
|
|
|
 |
 |
 |
 |
 |
 |
 |
| Debt ratios |
|
|
|
|
|
|
 |
 |
 |
 |
 |
 |
 |
| Interest cover ratio |
|
|
|
|
|
|
 |
 |
 |
 |
 |
 |
 |
| Earnings before interest, tax, depreciation and amortisation |
1,207 |
|
633 |
|
1,088 |
|
| Interest on borrowings |
54 |
|
54 |
|
75 |
|
 |
 |
 |
 |
 |
 |
 |
| Interest cover (times) |
22.4 |
|
11.7 |
|
14.5 |
|
 |
 |
 |
 |
 |
 |
 |
| |
|
|
|
|
|
|
 |
 |
 |
 |
 |
 |
 |
| Debt/Equity ratio |
|
|
|
|
|
|
 |
 |
 |
 |
 |
 |
 |
| Non-recourse project financing |
538 |
41 |
399 |
36 |
513 |
27 |
 |
 |
 |
 |
 |
 |
 |
| Long-term debt |
622 |
47 |
546 |
49 |
472 |
25 |
 |
 |
 |
 |
 |
 |
 |
| Short-term debt |
163 |
12 |
161 |
15 |
921 |
48 |
 |
 |
 |
 |
 |
 |
 |
 |
 |
 |
 |
 |
 |
 |
| |
1,323 |
100 |
1,106 |
100 |
1,906 |
100 |
 |
 |
 |
 |
 |
 |
 |
 |
 |
 |
 |
 |
 |
 |
| Less : Cash and cash equivalents |
(1,186) |
|
(1,231) |
|
(2,100) |
|
 |
 |
 |
 |
 |
 |
 |
| Net debt/(cash) |
137 |
|
(125) |
|
(194) |
|
 |
 |
 |
 |
 |
 |
 |
| Net (cash) excluding project financing |
(238) |
|
(394) |
|
(575) |
|
 |
 |
 |
 |
 |
 |
 |
| |
|
|
|
|
|
|
 |
 |
 |
 |
 |
 |
 |
| Net gearing excluding project financing (times) |
Net cash |
|
Net cash |
|
Net cash |
|
 |
 |
 |
 |
 |
 |
 |
| Net gearing including project financing (times) |
0.04 |
|
Net cash |
|
Net cash |
|
 |
 |
 |
 |
 |
 |
 |
| |
|
|
|
|
|
|
 |
 |
 |
 |
 |
 |
 |
| Cost of funding |
|
|
|
|
|
|
 |
 |
 |
 |
 |
 |
 |
| Floating |
|
3.59 |
|
2.73 |
|
2.78 |
 |
 |
 |
 |
 |
 |
 |
| Fixed |
|
3.59 |
|
3.78 |
|
4.57 |
 |
 |
 |
 |
 |
 |
 |
| Weighted average cost of funds |
|
3.85 |
|
3.41 |
|
3.67 |
 |
 |
 |
 |
 |
 |
 |
| |
|
|
|
|
|
|
|
| |
| |
|
|
|