|
Five-Year Performance
| Financials |
2001 |
2002 |
2003 |
2004 |
2005 |
 |
| For the year (S$’m) |
 |
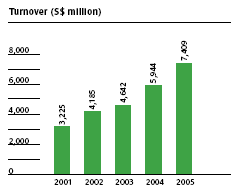
| Turnover |
3,225 |
4,185 |
4,642 |
5,944 |
7,409 |
 |
| EBITDA |
484 |
497 |
583 |
1,112 |
668 |
 |
| Profit before income tax expense |
340 |
291 |
471 |
982 |
508 |
 |
| Profit attributable to Shareholders of the Company (PATMI): |
 |
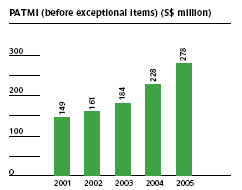
| – before exceptional items |
149 |
161 |
184 |
228 |
278 |
 |
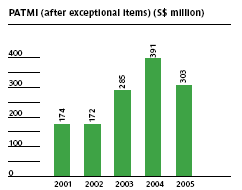
| – after exceptional items |
174 |
172 |
285 |
391 |
303 |
 |
| |
 |
| At year end (S$’m) |
 |
| Property, plant and equipment |
2,257 |
2,164 |
2,514 |
2,492 |
2,627 |
 |
| Other non-current assets |
1,406 |
1,421 |
1,414 |
1,220 |
1,171 |
 |
| Net current assets/(liabilities) |
(399) |
79 |
51 |
245 |
305 |
 |
| Non-current liabilities |
(1,574) |
(1,525) |
(1,595) |
(1,156) |
(1,258) |
 |
 |
 |
| Net assets |
1,690 |
2,139 |
2,384 |
2,801 |
2,845 |
 |
 |
 |
| |
 |
| Share capital and reserves |
1,026 |
1,504 |
1,716 |
1,958 |
2,000 |
 |
| Minority interests |
664 |
635 |
668 |
843 |
845 |
 |
 |
 |
| Total Equity |
1,690 |
2,139 |
2,384 |
2,801 |
2,845 |
 |
 |
 |
| |
 |
| Per share |
 |
| Earnings (cents) |
|
|
|
|
|
 |
| – before exceptional items |
9.30 |
8.96 |
10.09 |
12.49 |
15.74 |
 |
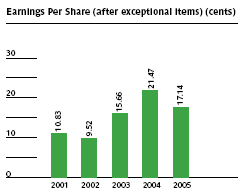
| – after exceptional items |
10.83 |
9.52 |
15.66 |
21.47 |
17.14 |
 |
| Net tangible assets (cents) |
59.00 |
80.71 |
88.16 |
98.69 |
105.74 |
 |
| Gross dividend (cents) |
3.00 |
4.50 |
7.00 |
11.25 |
6.50 |
 |
| Gross dividend yield (%)* |
1.90 |
5.70 |
5.60 |
6.90 |
2.40 |
 |
| |
 |
| Financial ratios |
|
|
|
|
|
 |
| Return on equity (%) |
18.5 |
13.6 |
17.7 |
21.1 |
15.3 |
 |
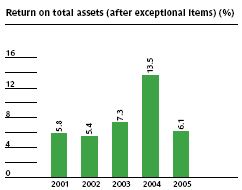
| Return on total assets (%) |
5.8 |
5.4 |
7.3 |
13.5 |
6.1 |
 |
| Interest cover (times) |
5.4 |
5.3 |
7.4 |
15.0 |
12.0 |
 |
| Net gearing (times) |
1.3 |
0.6 |
0.6 |
Net Cash |
Net Cash |
 |
| |
 |
| * Based on the closing share price for respective years. |
 |
| Economic Value Added |
2001 |
2002 |
2003 |
2004 |
2005 |
 |
| |
S$’m |
S$’m |
S$’m |
S$’m |
S$’m |
 |
| Net Operating Profit after Tax (NOPAT) |
331 |
333 |
383 |
645 |
545 |
 |
| |
 |
| Average Capital Employed |
4,596 |
5,176 |
5,195 |
5,472 |
5,276 |
 |
| Capital Charge |
387 |
423 |
292 |
340 |
294 |
 |
| |
 |
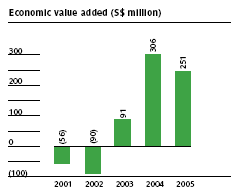
| Economic Value Added (EVA) |
(56) |
(90) |
91 |
306 |
251 |
 |
| |
 |
| Productivity Data |
|
|
|
|
|
 |
| |
2001 |
2002 |
2003 |
2004 |
2005 |
 |
| Average staff strength |
15,000 |
13,168 |
12,430 |
13,301 |
14,862 |
 |
| Employment costs ($’m) |
538 |
579 |
540 |
573 |
621 |
 |
| Sales per employee ($’000) |
215 |
318 |
373 |
447 |
491 |
 |
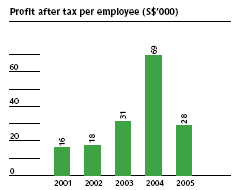
| Profit after tax per employee ($’000) |
16 |
18 |
31 |
69 |
28 |
 |
| |
|
|
|
|
|
 |
| Economic value added ($’m) |
(56) |
(90) |
91 |
306 |
251 |
 |
| Economic value added spread (%) |
(1.2) |
(1.7) |
1.8 |
5.6 |
4.8 |
 |
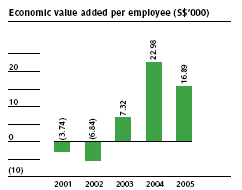
| Economic value added per employee($’000) |
(3.74) |
(6.84) |
7.32 |
22.98 |
16.89 |
 |
| |
|
|
|
|
|
 |
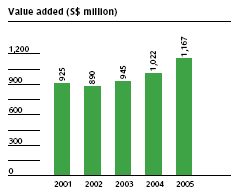
| Value added ($’m) |
925 |
890 |
945 |
1,022 |
1,167 |
 |
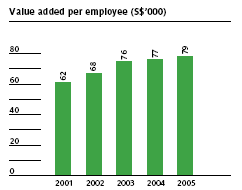
| Value added per employee ($’000) |
62 |
68 |
76 |
77 |
79 |
 |
| Value added per employment costs ($) |
1.72 |
1.54 |
1.75 |
1.79 |
1.88 |
 |
| Value added per dollar investment in fixed assets ($) |
0.32 |
0.32 |
0.27 |
0.29 |
0.30 |
 |
| Value added per dollar sales ($) |
0.29 |
0.22 |
0.21 |
0.17 |
0.16 |
 |
| Review By Businesses |
2001 |
% |
2002 |
% |
2003 |
% |
2004 |
% |
2005 |
% |
 |
| |
S$’m |
|
S$’m |
|
S$’m |
|
S$’m |
|
S$’m |
|
 |
| |
|
|
|
|
|
|
|
|
|
|
 |
| Turnover by Activity |
|
|
|
|
|
|
|
|
|
|
 |
| Utilities |
548 |
17 |
1,072 |
26 |
1,933 |
42 |
2,909 |
49 |
3,262 |
44 |
 |
| Marine Engineering |
850 |
26 |
1,007 |
24 |
1,062 |
23 |
1,351 |
23 |
2,102 |
28 |
 |
| Logistics |
469 |
15 |
429 |
10 |
465 |
10 |
500 |
8 |
542 |
7 |
 |
| Environmental Engineering |
140 |
4 |
135 |
3 |
190 |
4 |
200 |
3 |
217 |
3 |
 |
| Engineering & Construction |
619 |
19 |
858 |
21 |
803 |
17 |
823 |
14 |
1,096 |
15 |
 |
| Others/Corporate |
599 |
19 |
684 |
16 |
189 |
4 |
161 |
3 |
190 |
3 |
 |
 |
 |
| Total |
3,225 |
100 |
4,185 |
100 |
4,642 |
100 |
5,944 |
100 |
7,409 |
100 |
 |
 |
 |
| |
|
|
|
|
|
|
|
|
|
|
 |
| Profit attributable to Shareholders of the Company by Activity |
 |
| Utilities |
35 |
20 |
54 |
31 |
98 |
35 |
108 |
28 |
147 |
49 |
 |
| Marine Engineering |
50 |
29 |
53 |
31 |
49 |
17 |
60 |
15 |
73 |
24 |
 |
| Logistics |
36 |
21 |
41 |
24 |
56 |
20 |
64 |
16 |
33 |
11 |
 |
| Environmental Engineering |
8 |
5 |
9 |
5 |
13 |
4 |
14 |
4 |
5 |
2 |
 |
| Engineering & Construction |
6 |
3 |
1 |
1 |
1 |
0 |
1 |
0 |
1 |
0 |
 |
| Others/Corporate |
14 |
8 |
3 |
2 |
(33) |
(11) |
(19) |
(5) |
19 |
6 |
 |
 |
 |
| |
149 |
86 |
161 |
94 |
184 |
65 |
228 |
58 |
278 |
92 |
 |
| Exceptional items |
25 |
14 |
11 |
6 |
101 |
35 |
163 |
42 |
25 |
8 |
 |
| Total |
25 |
14 |
11 |
6 |
101 |
35 |
163 |
42 |
25 |
8 |
 |
 |
 |
| Value Added Statements |
2001 |
2002 |
2003 |
2004 |
2005 |
 |
| |
S$’m |
S$’m |
S$’m |
S$’m |
S$’m |
 |
| Value added from |
|
|
|
|
|
 |
| Turnover |
3,170 |
3,997 |
4,565 |
5,867 |
7,304 |
 |
| Less: bought in materials and services |
(2,245) |
(3,107) |
(3,620) |
(4,845) |
(6,137) |
 |
 |
 |
| Gross value added |
925 |
890 |
945 |
1,022 |
1,167 |
 |
| |
 |
| Investment, interest and other income |
188 |
311 |
266 |
1,264 |
240 |
 |
| Share of associated companies’ profit |
72 |
26 |
108 |
121 |
53 |
 |
| Share of joint ventures’ profit |
23 |
37 |
37 |
35 |
48 |
 |
| Other non-operating income/(expenses) |
(19) |
(59) |
(41) |
(554) |
(74) |
 |
 |
 |
| |
1,189 |
1,205 |
1,315 |
1,888 |
1,434 |
 |
 |
 |
| |
|
|
|
|
|
 |
| Distribution |
|
|
|
|
|
 |
| To employees in wages, salaries and benefits |
538 |
579 |
540 |
573 |
621 |
 |
| To government in income and other taxes |
100 |
66 |
103 |
110 |
137 |
 |
| To providers of capital on: |
|
|
|
|
|
 |
| Interest paid on borrowings |
74 |
76 |
72 |
73 |
54 |
 |
| Dividends to shareholders |
30 |
43 |
28 |
91 |
73 |
 |
| |
742 |
764 |
743 |
847 |
885 |
 |
 |
 |
| |
|
|
|
|
|
 |
| Retained in Business |
|
|
|
|
|
 |
| Depreciation and amortisation |
135 |
168 |
164 |
170 |
174 |
 |
| Retained profits |
219 |
153 |
270 |
302 |
235 |
 |
| Minority interests |
83 |
88 |
97 |
526 |
112 |
 |
 |
 |
| |
437 |
409 |
531 |
998 |
521 |
 |
| |
|
|
|
|
|
 |
| Other non-operating expenses |
10 |
32 |
41 |
43 |
28 |
 |
| |
447 |
441 |
572 |
1,041 |
549 |
 |
| |
|
|
|
|
|
 |
| Total Distribution |
1,189 |
1,205 |
1,315 |
1,888 |
1,434 |
 |
 |
 |
| |
|
|
|
|
|
 |
| The figures above reflect core businesses only. |
|
|
|
|
|
 |
|


 |
|
|