OVERVIEW
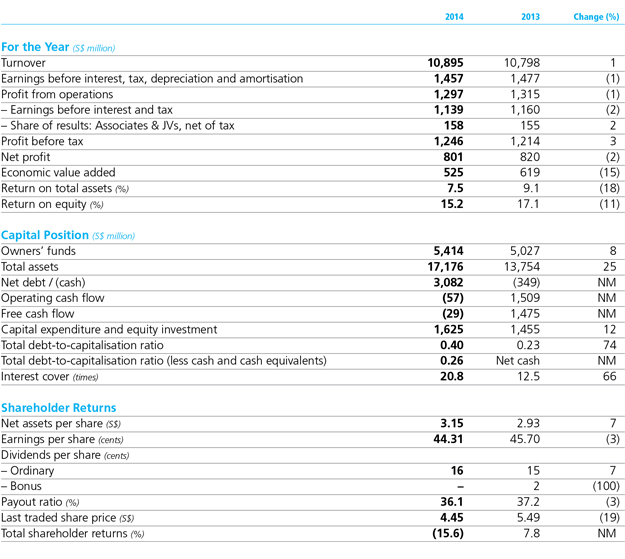
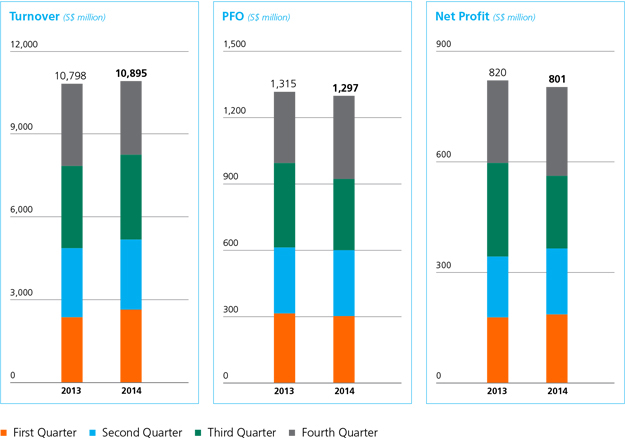
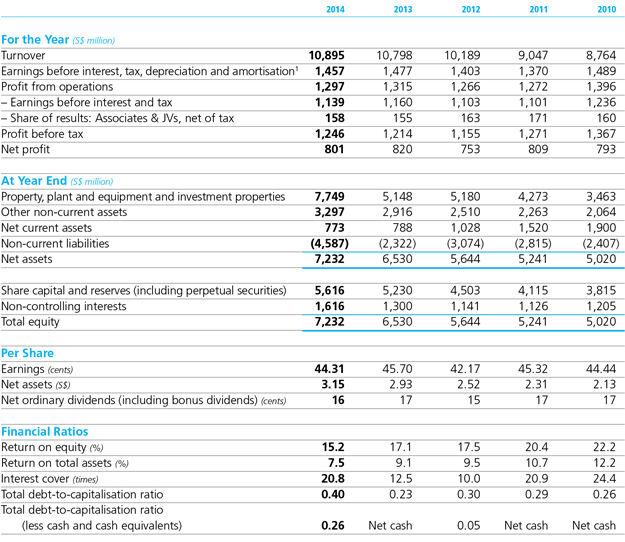
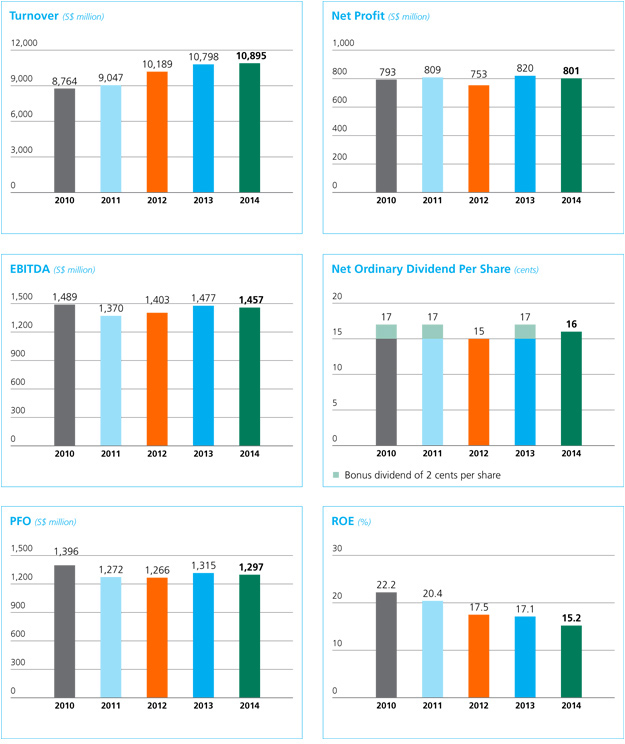
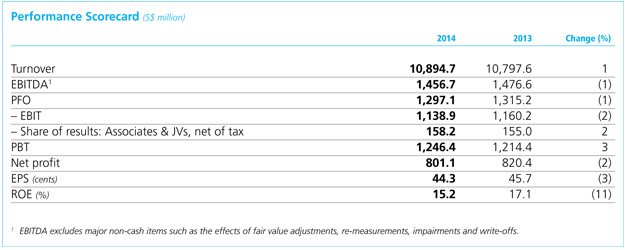
Amid challenging market conditions, Sembcorp delivered a net profit of S$801.1 million and a turnover of S$10.9 billion in 2014. The Group’s net profit in 2014 was up 3% from 2013 excluding significant items recorded in 2013. These significant items comprised gains from the initial public offering of Sembcorp Salalah Power and Water Company (Sembcorp Salalah), offset by an impairment made for utilities operations in the UK and a fair value loss recorded following the reclassification of Gallant Venture as an available-for-sale financial asset.
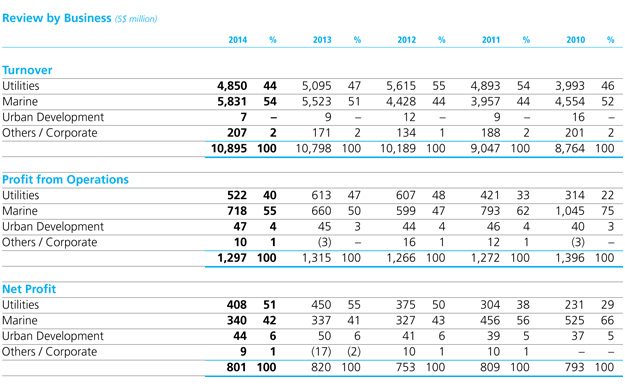
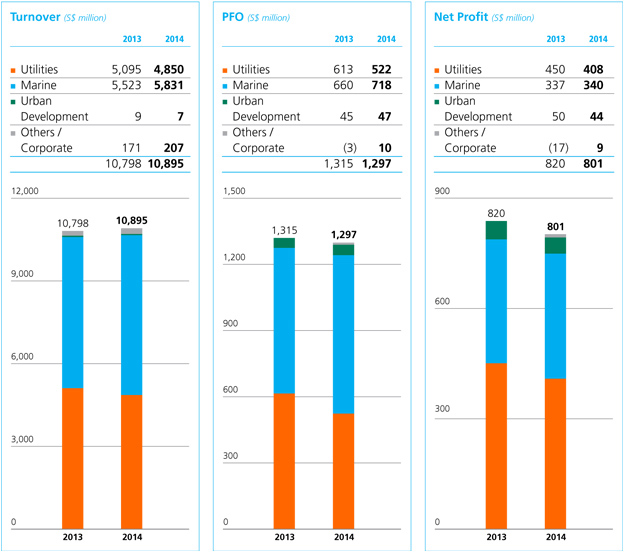
The Utilities and Marine businesses continued to be our main profit contributors, accounting for 51% and 42% of Group net profit respectively.
TURNOVER
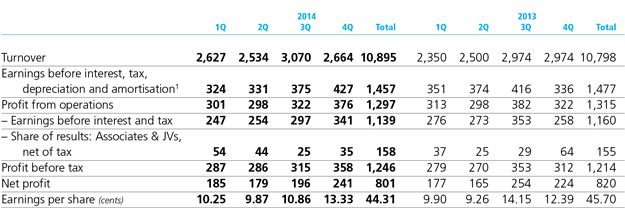
The Group achieved a turnover of S$10.9 billion, with the Utilities and Marine businesses contributing 98% of total turnover.
The Utilities business’ turnover was lower mainly due to the deconsolidation of Sembcorp Salalah, lower gas offtake and lower high sulphur fuel oil prices recorded during the year.
The Marine business’ turnover increased by 6% in 2014 to S$5.8 billion, mainly due to higher revenue recognition for its rig building projects and offshore and conversion projects.
NET PROFIT
The Group recorded a net profit of S$801.1 million in 2014 compared to S$820.4 million in 2013, while profit from operations was S$1.3 billion, comparable to previous year.
In 2014, the Utilities business’ net profit was S$408.0 million compared to S$449.9 million in 2013. Excluding significant items in 2013, which amounted to S$68.6 million (comprising gains from the initial public offering of Sembcorp Salalah and offset by an impairment made for utilities operations in the UK), our Utilities business achieved a 7% net profit growth in 2014.
Meanwhile, our Marine business contributed S$340.0 million in net profit, compared to S$336.9 million in 2013. This was mainly due
to higher operating profit. In 2013, our Marine business also reported lower tax expense due to a write-back of tax on recognition of tax incentives.
CASH FLOW AND LIQUIDITY
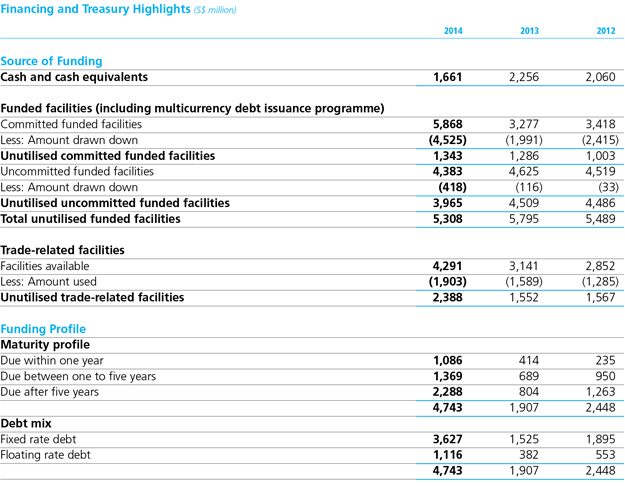
As at December 31, 2014, the Group’s cash and cash equivalents stood at S$1.7 billion.
Cash flows from operating activities before changes in working capital stood at close to
S$1.5 billion in 2014, a slight increase compared
to 2013. Net cash from operating activities for 2014 was an outflow of S$57.4 million compared to a net
cash inflow of S$1.5 billion in 2013, mainly arising from change in working capital for ongoing rig building projects.
Net cash outflow from investing activities for 2014 was S$1.4 billion. S$1.6 billion was spent on purchase of property, plant and equipment and equity investments. This cash outflow was partially reduced by dividends received and net cash inflow from the acquisition of Thermal Powertech Corporation India (TPCIL).
Net cash inflow from financing activities of S$900.6 million for 2014 was mainly related to net proceeds from borrowings, partially offset by dividends and interest paid.
FINANCIAL POSITION
Group shareholders’ funds increased to S$5.4 billion as at December 31, 2014 from S$5.0 billion as at December 31, 2013.
Non-current assets increased primarily due to an increase in equity interest in TPCIL from 49% to 65%. With this, TPCIL became a subsidiary of Sembcorp and its financials were consolidated into the Group’s financial statements thereafter. The increase in non-current assets was also a result
of additional equity investments by the Utilities business, mainly in India and Vietnam, as well as our share of profits contributed by associates and joint ventures during the year.
Inventories and work-in-progress increased primarily due to the payment terms of rig building projects. The excess of progress billings over work-in-progress decreased mainly due to timing of billing for rig building projects.
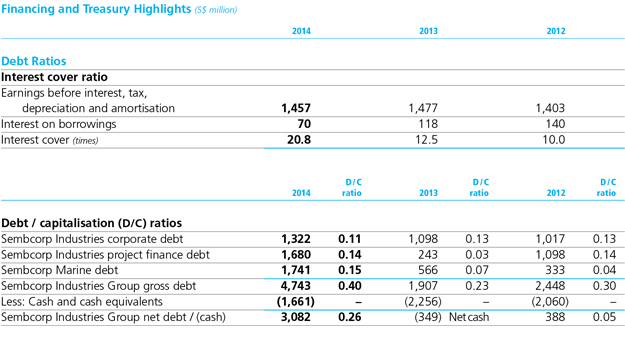
Interest-bearing borrowings increased, mainly arising from the consolidation of TPCIL and additional borrowings by the Marine business for capital expenditure for its Brazil yard.
SHAREHOLDER RETURNS
Return on equity for the Group was 15.2% and earnings per share amounted to 44.3 cents in 2014.
Subject to approval by shareholders at the next annual general meeting, a final ordinary one-tier tax exempt dividend of 11.0 cents per share has been proposed for the financial year ended December 31, 2014. Together with an interim dividend of 5.0 cents per ordinary share paid in September 2014, this brings our total dividend for the year to 16.0 cents per ordinary share.
ECONOMIC VALUE ADDED
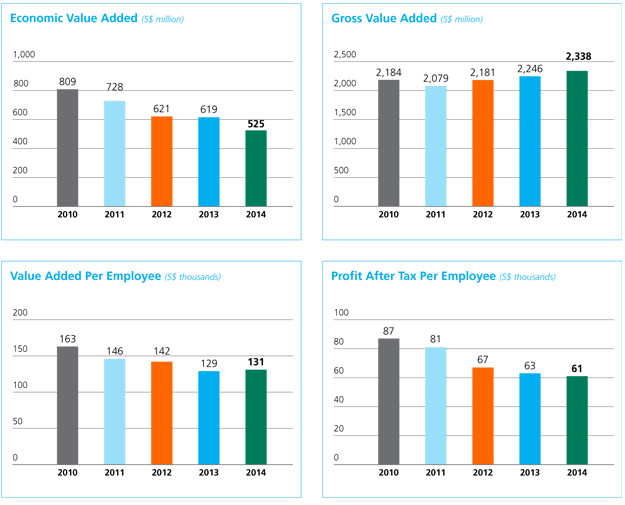
The Group generated positive economic value added of S$524.7 million in 2014.
Our net operating profit after tax for 2014 amounted to S$1.2 billion, while capital charges increased to S$642.9 million, mainly due to a higher capital base for building up our capacities.
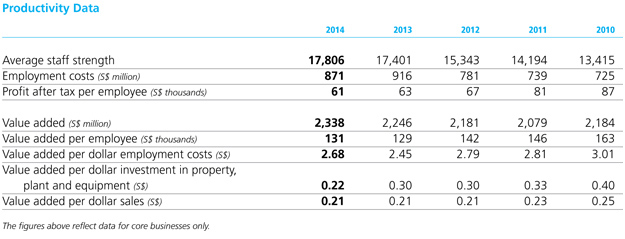
VALUE ADDED AND
PRODUCTIVITY DATA
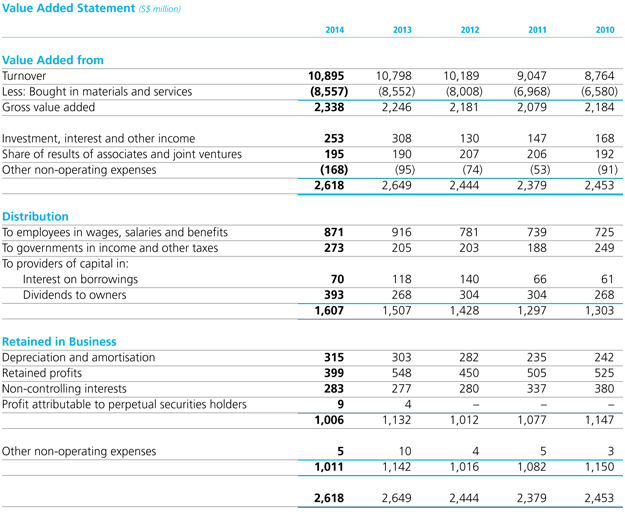
In 2014, the Group’s total value added was S$2.6 billion. This was absorbed by employees
in wages, salaries and benefits of S$871 million, by governments in income and other taxes of S$273 million and by providers of capital in interest and dividends of S$463 million, leaving a balance of S$1.0 billion reinvested in business.
CRITICAL ACCOUNTING POLICIES
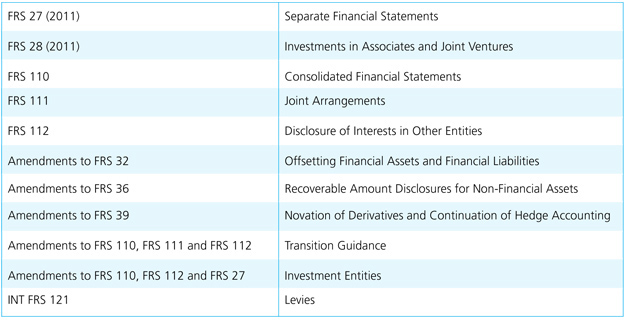
Sembcorp’s financial statements are prepared in accordance with Singapore Financial Reporting Standards (FRSs).
With effect from January 1, 2014, the Group adopted the following new / amended FRSs, set out in the table below.
The adoption of the FRSs below (including consequential amendments) does not have any significant impact on the Group’s financial statements, except for additional disclosures in the Notes to the Financial Statements.
FINANCIAL RISK MANAGEMENT
The Group’s activities expose it to a variety of financial risks, including changes in interest rates, foreign exchange rates and commodity prices,
as well as credit risk.
Please refer to the
Risk Management and Internal Controls chapter of this report for details on the management of these risks.
TREASURY MANAGEMENT
Sembcorp Financial Services (SFS), the Group’s wholly-owned treasury vehicle, manages the Group’s financing activities, as well as its treasury activities in Singapore. As the Group expands outside of Singapore, we also set up additional treasury units in other respective countries to manage local in-country treasury activities where necessary. SFS facilitates funding and on-lends funds borrowed by it to businesses within the Group, where appropriate.
SFS and our overseas treasury units actively manage cash within the Group by setting up cash pooling structures in various countries, where appropriate, to take in surplus funds from businesses and lend it to those with funding requirements. We also actively manage the Group’s excess cash, deploying it to a number of financial institutions, and closely track developments in the global banking sector. Such proactive cash management continues to be an efficient and cost-effective way of managing the Group’s cash and financing its funding requirements.
FACILITIES
As at December 31, 2014, the Group’s total credit facilities, including the multicurrency debt issuance programme, amounted to S$14.5 billion (2013: S$11.0 billion). This comprised S$10.3 billion (2013: S$7.9 billion) in funded facilities and S$4.3 billion (2013: S$3.1 billion) in trade-related facilities, including but not limited to bank guarantees, letters of credit, bid bonds and performance bonds. The increase over the previous year was mainly due to the Marine business’ new credit facilities
to fund its Singapore and Brazil yards, as well as the consolidation of TPCIL following the increase of our share in it from 49% to 65%.
BORROWINGS AND ISSUANCE
OF MEDIUM-TERM NOTES
SFS issued S$100 million of seven-year notes and another S$150 million of 12-year notes in November 2014 under its S$2 billion multicurrency debt issuance programme. The Group aims to term out loans such that their maturity profile mirrors the operating life of our core assets, while continuing our focus on maintaining adequate liquidity for our businesses. We continue to build on our banking relationships to ensure that we are able to secure funding on competitive terms, as and when commercially viable and strategically attractive opportunities arise.
As at December 31, 2014, the Group’s gross borrowings amounted to S$4.7 billion (2013: S$1.9 billion). As compared to 2013, the increment of S$2.8 billion in gross borrowings was mainly due to the Marine business’ new credit facilities and the consolidation of TPCIL.
The Group remains committed to balancing the availability of funding and the cost of funding, while maintaining prudent financial ratios. We also aim to maintain an efficient and optimal mix of committed and uncommitted facilities and fixed and floating rate borrowings. Of the overall debt portfolio, 76% (2013: 80%) constituted fixed rate debts that were not exposed to interest rate fluctuations.