
GROUP FINANCIAL REVIEW
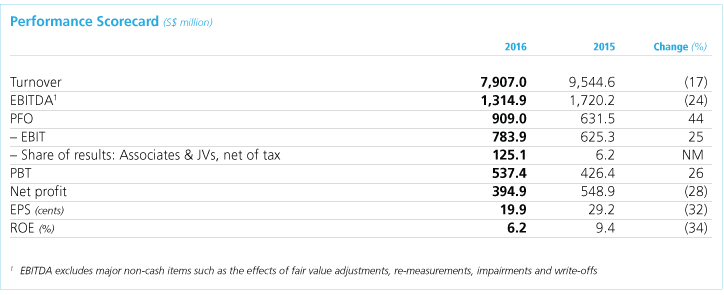
GROUP FINANCIAL HIGHLIGHTS

1 In the interest of consistency, the previous year’s economic value added has been restated to include capital charge deferral. Capital charge deferral (net) refers to deferral of capital charges for investments made in projects where returns are not immediate at the time of investment (eg. greenfield projects) less cost of deferral of weighted average cost of capital
GROUP QUARTERLY PERFORMANCE (S$ million)
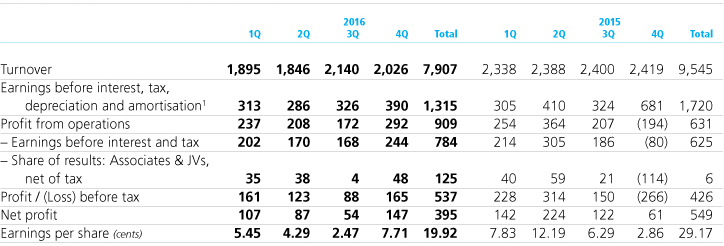
1 Earnings before interest, tax, depreciation and amortisation exclude major non-cash items such as the effects of fair value adjustments, re-measurements, impairments and write-offs.

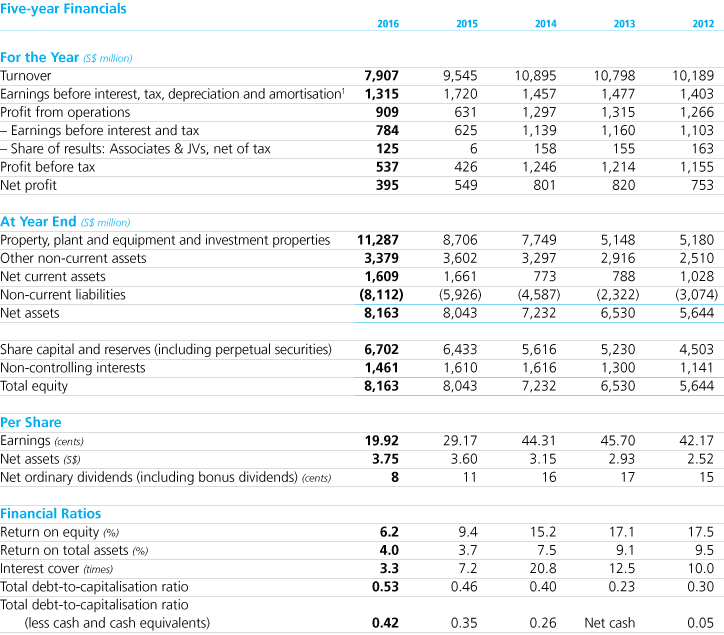
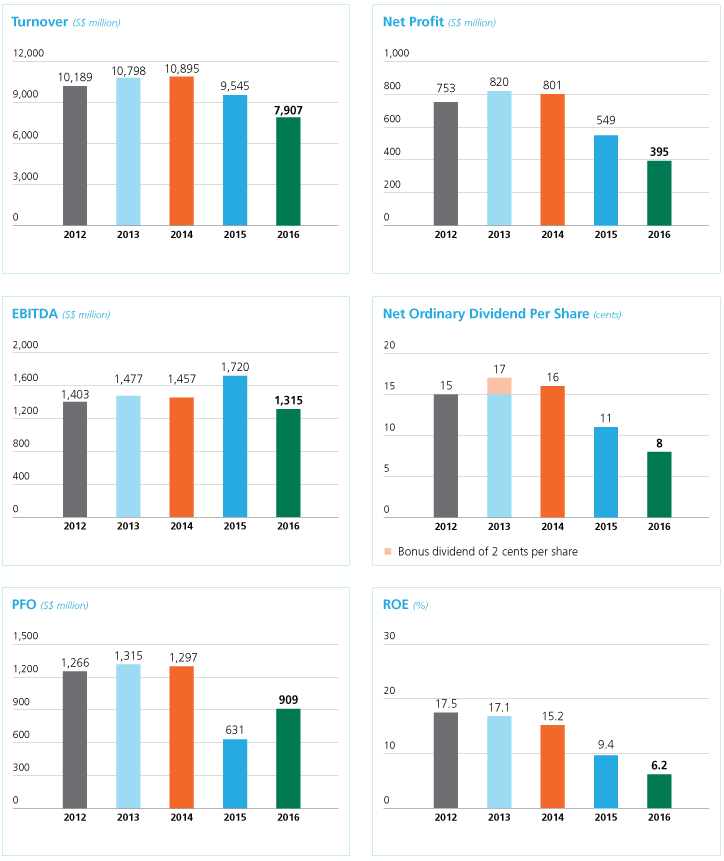
FIVE-YEAR FINANCIAL PERFORMANCE PROFILE
2016
Sembcorp posted a net profit of S$394.9 million and a turnover of S$7.9 billion in 2016, compared to S$548.9 million and S$9.5 billion respectively in 2015.
In 2016, the Utilities business contributed S$348.0 million in net profit to the Group. 63% of this net profit was generated by its overseas operations. Excluding exceptional items, the business delivered a profit growth of 4% over 2015, backed by record profits in China of S$124.8 million. Exceptional items recorded by the business in 2016 amounted to S$2.5 million, comprising S$33.5 million from the divestment gain on the sale of a municipal water operation in Yancheng, China, less S$31.0 million total refinancing cost for the Thermal Powertech Corporation India power plant. Exceptional items recorded by the business for 2015 amounted to S$369.9 million, comprising divestment gains of S$425.6 million from the sale of a waste management joint venture in Australia and municipal water operations in Bournemouth, UK and Zhumadian, China, less S$55.7 million comprising S$31.4 million from the exit of the chemical feedstock business and impairment of assets in Singapore (net of settlement amounts from customers) and S$24.3 million in net allowance for doubtful debts in China.
The Marine business’ net profit contribution to the Group was S$48.3 million in 2016, compared to a net loss of S$176.4 million in 2015. The business’ net loss in 2015 was mainly due to write-downs of inventory and work-in-progress and provisions for foreseeable losses for rig building projects. Meanwhile, the Urban Development business reported a net profit of S$33.3 million, comparable to S$33.5 million in the previous year.
Return on equity for the Group was 6.2% and earnings per share amounted to 19.9 cents.
2015
Sembcorp posted a net profit of S$548.9 million and a turnover of S$9.5 billion for 2015 compared to S$801.1 million and S$10.9 billion in 2014 respectively.
In 2015, the Utilities business delivered a 72% growth in net profit to S$701.5 million compared to S$408.0 million in 2014. This increase was underpinned by growth from its overseas operations as well as gains from the sale of its Australian waste management joint venture and municipal water operations in the UK and Zhumadian, China.
Meanwhile, at the Sembcorp Industries level, the Marine business incurred a net loss of S$176.4 million in 2015 compared to a net profit of S$340.0 million in 2014. The Urban Development business posted a net profit of S$33.5 million compared to S$44.3 million in 2014.
2014
Sembcorp delivered a healthy performance in 2014 amid challenging market conditions. Net profit for the year was S$801.1 million, while turnover stood at S$10.9 billion.
In 2014, the Utilities business reported a net profit of S$408.0 million, compared to S$449.9 million in 2013. The business achieved a 7% net profit growth in 2014 from 2013 excluding gains from the initial public offering of Sembcorp Salalah Power and Water Company (Sembcorp Salalah) offset by an impairment made for operations in the UK.
The Marine business contributed S$340.0 million to the Group’s net profit in 2014, compared to S$336.9 million in 2013. Meanwhile, the Urban Development business reported a net profit of S$44.3 million, compared to S$50.2 million in the previous year.
2013
Sembcorp delivered a robust performance for 2013. Net profit grew 9% to S$820.4 million from S$753.3 million in 2012, while turnover increased 6% to S$10.8 billion from S$10.2 billion the previous year.
In 2013, the Utilities business delivered strong profit growth of 20%, with net profit increasing to S$449.9 million from S$374.6 million in 2012, underpinned by solid growth from operations in China and gains from the initial public offering of Sembcorp Salalah, partially offset by an impairment made for operations in the UK.
The Marine business reported a net profit of S$336.9 million in 2013, up 3% from S$326.7 million in 2012. Meanwhile, the Urban Development business reported a 22% increase in net profit to S$50.2 million from S$41.1 million the previous year.
2012
Sembcorp reported a net profit of S$753.3 million for the full year 2012, compared to S$809.3 million in 2011. Turnover grew 13% to S$10.2 billion from S$9.0 billion in the previous year.
In 2012, the Utilities business achieved a net profit of S$374.6 million, growing 23% from S$304.4 million in 2011. This was due to a better performance by Singapore operations, attributable to additional gas sales during the year.
Our Marine business contributed S$326.7 million in net profit for the year.
| 1 | Earnings before interest, tax, depreciation and amortisation excludes major non-cash items such as the effects of fair value adjustments, re-measurements, impairments and write-offs. |
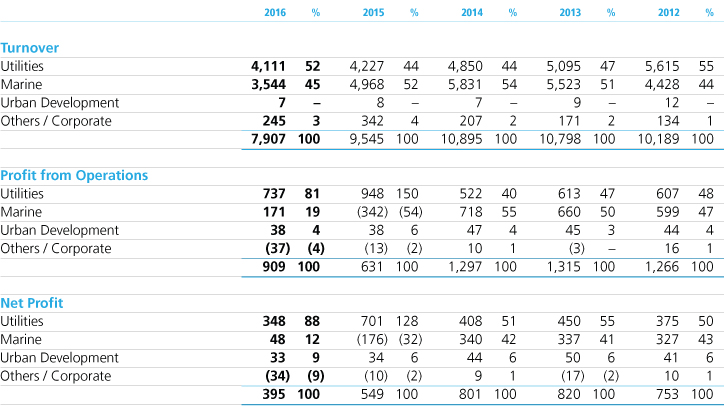
Review by Business (S$ million)
OVERVIEW
Sembcorp posted a net profit of S$394.9 million and a turnover of S$7.9 billion for 2016, compared to S$548.9 million and S$9.5 billion respectively in 2015.
TURNOVER
The Group achieved a turnover of S$7.9 billion, with the Utilities and Marine businesses contributing 97% of total turnover.
The Utilities business’ turnover was lower in 2016 compared to 2015, mainly due to lower high sulphur fuel oil prices recorded during the year, partially mitigated by higher contribution from India operations and recognition of service concession revenue for its Myanmar project.
The Marine business’ turnover decreased over the previous year, mainly due to lower revenue recognition for rig building projects resulting from customers’ delivery deferment requests and lower contributions from its repairs business. For the offshore platforms segment, turnover was higher in 2016.
NET PROFIT
The Group recorded a net profit of S$394.9 million in 2016 compared to S$548.9 million in 2015, while profit from operations was S$909.0 million, compared to S$631.5 million in 2015.
In 2016, the Utilities business made S$348.0 million in net profit. 63% of this net profit was generated by its overseas operations. Excluding exceptional items, the business delivered a profit growth of 4% over 2015, backed by record profits in China of S$124.8 million. Exceptional items recorded by the business in 2016 amounted to S$2.5 million, comprising S$33.5 million from the divestment gain on the sale of a municipal water operation in Yancheng, China, less S$31.0 million total refinancing cost for the Thermal Powertech Corporation India power plant. Exceptional items recorded by the business for 2015 amounted to S$369.9 million, comprising divestment gains of S$425.6 million from the sale of a waste management joint venture in Australia and municipal water operations in Bournemouth, UK and Zhumadian, China, less S$55.7 million comprising S$31.4 million from the exit of the chemical feedstock business and impairment of assets in Singapore (net of settlement amounts from customers) and S$24.3 million in net allowance for doubtful debts in China.
The Marine business’ net profit contribution to the Group was S$48.3 million in 2016, compared to a net loss of S$176.4 million in 2015. The business’ net loss in 2015 was mainly due to write-downs of inventory and work-in-progress and provisions for foreseeable losses for rig building projects.
Meanwhile, the Urban Development business reported a net profit of S$33.3 million in 2016, comparable to S$33.5 million in the previous year. Net profit from Corporate included a fair value loss of S$57.7 million in 2016, compared to a fair value loss of S$34.5 million in 2015, due to the decline in the share price of Gallant Venture.
CASH FLOW AND LIQUIDITY
As at December 31, 2016, the Group’s cash and cash equivalents stood at S$1.9 billion.
Net cash from operating activities for 2016 was mainly due to the Marine business’ receipts from completed rig building projects, partially offset by the Utilities business’ working capital for its India operations.
Net cash outflow from investing activities for 2016 was S$800.6 million, comprising mainly spending on step-up acquisition of subsidiaries and purchase of property, plant and equipment primarily for the expansion and operation of the Marine business’ yards, partially offset by proceeds from the disposal of other financial assets and dividends received.
Net cash inflow from financing activities of S$213.8 million for 2016 was related mainly to net proceeds from borrowings, partially offset by dividends and interest paid.
FINANCIAL POSITION
Group shareholders’ funds increased to S$5.9 billion as at December 31, 2016 from S$5.6 billion as at December 31, 2015.
The Group’s balance sheet reflects the consolidation of Sembcorp Gayatri Power as a subsidiary, following the Utilities business increasing its ownership in the unit from 49% to 65%, and subsequently to 88%. It also reflects the consolidation of Gravifloat as a subsidiary of the Group, following the increase in Sembcorp Marine’s shareholding in the unit from 12% to 56%.
Non-current assets increased in 2016, primarily due to the consolidation of Sembcorp Gayatri Power and Gravifloat by the Utilities business and Marine business respectively.
Inventories and work-in-progress decreased, primarily due to reduced work-in-progress at the Marine business following the successful delivery of jack-up rigs. Recoverability of work-in-progress for rig building is dependent on customers taking delivery of the rigs in the future.
Interest-bearing borrowings increased in 2016 due to consolidation of Sembcorp Gayatri Power and the Marine business’ borrowings for working capital and capital expenditure for its Singapore and Brazil yards.
SHAREHOLDER RETURNS
Return on equity for the Group was 6.2% and earnings per share amounted to 19.9 cents in 2016.
Subject to approval by shareholders at the next annual general meeting, a final ordinary one-tier tax-exempt dividend of 4.0 cents per share has been proposed for the financial year ending December 31, 2016. Together with an interim dividend of 4.0 cents per ordinary share paid in August 2016, this brings our total dividend for the year to 8.0 cents per ordinary share.
Subject to approval by shareholders at the next annual general meeting, a final ordinary one-tier tax-exempt dividend of 4.0 cents per share has been proposed for the financial year ending December 31, 2016. Together with an interim dividend of 4.0 cents per ordinary share paid in August 2016, this brings our total dividend for the year to 8.0 cents per ordinary share.
ECONOMIC VALUE ADDED
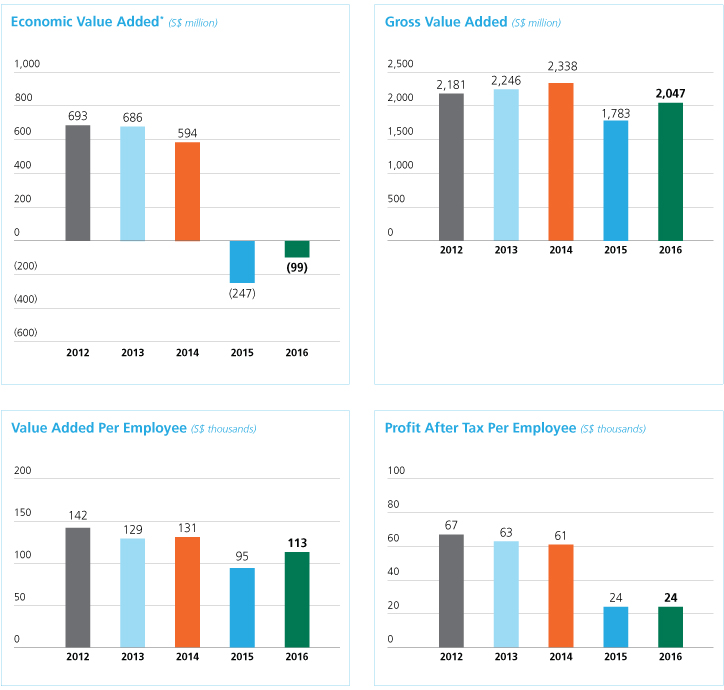
Economic value added (EVA) was negative in 2016, mainly due to weaker performance by the Marine business’ rig building operations. In 2016, EVA also included the effect of new investments in early stages of operation.
VALUE ADDED AND PRODUCTIVITY DATA
In 2016, the Group’s total value added was S$2.2 billion. This was absorbed by employees in wages, salaries and benefits of S$800 million, by governments in income and other taxes of S$119 million and by providers of capital in interest, dividends and distribution of S$620 million, leaving a balance of S$678 million reinvested in our businesses.
CRITICAL ACCOUNTING POLICIES
Sembcorp’s financial statements are prepared in accordance with Singapore Financial Reporting Standards (FRSs).
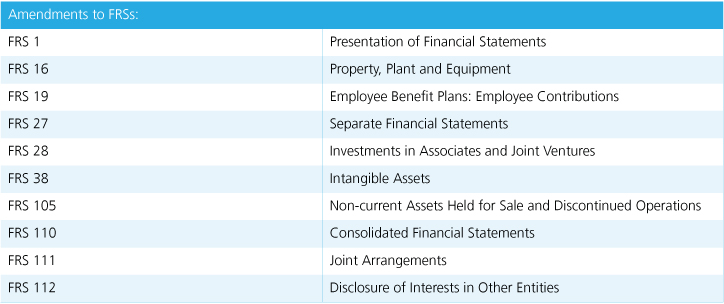
With effect from January 1, 2016, the Group adopted the following new / amended FRSs, set out in the table below.
The adoption of the FRSs below (including consequential amendments) does not have any significant impact on the Group’s financial statements.
With effect from January 1, 2016, the Group adopted the following new / amended FRSs, set out in the table below.
The adoption of the FRSs below (including consequential amendments) does not have any significant impact on the Group’s financial statements.
FINANCIAL RISK MANAGEMENT
The Group’s activities expose it to a variety of financial risks, including changes in interest rates, foreign exchange rates and commodity prices, as well as credit risk.
Please refer to the Environmental, Social and Governance Review in this annual report for details on the management of these risks.

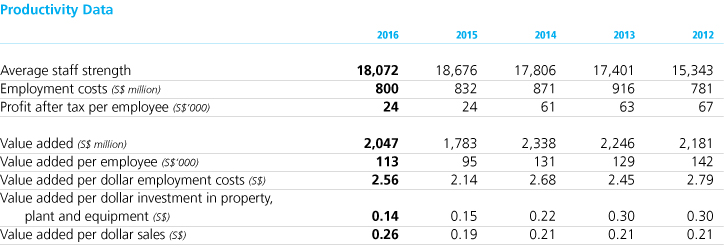
The figures above reflect data for core businesses only.
Please refer to the Environmental, Social and Governance Review in this annual report for details on the management of these risks.
| * | In the interest of consistency, prior years’ economic value added has been restated to include capital charge deferral. Capital charge deferral (net) refers to deferral of capital charges for investments made in projects where returns are not immediate at the time of investment (eg. greenfield projects) less cost of deferral at weighted average cost of capital |
Value Added Statement (S$ million)
The figures above reflect data for core businesses only.
TREASURY MANAGEMENT
Sembcorp Financial Services (SFS), the Group’s wholly-owned treasury vehicle, manages the Group’s financing activities, as well as its treasury activities in Singapore. SFS also oversees financing and treasury activities outside of Singapore together with the respective business units. In addition, SFS facilitates funding and on-lends funds borrowed by it to businesses within the Group, where appropriate.
SFS and our overseas treasury units actively manage cash within the Group by setting up cash pooling structures in various countries where appropriate, to take in surplus funds from businesses and lend it to those with funding requirements. We also actively manage the Group’s excess cash, deploying it to a number of financial institutions, and closely track developments in the global banking sector. Such proactive cash management continues to be an efficient and cost-effective way of managing the Group’s cash and financing its funding requirements.
SFS and our overseas treasury units actively manage cash within the Group by setting up cash pooling structures in various countries where appropriate, to take in surplus funds from businesses and lend it to those with funding requirements. We also actively manage the Group’s excess cash, deploying it to a number of financial institutions, and closely track developments in the global banking sector. Such proactive cash management continues to be an efficient and cost-effective way of managing the Group’s cash and financing its funding requirements.
FACILITIES
As at December 31, 2016, the Group’s total credit facilities, including its multi-currency debt issuance programme, amounted to S$20.5 billion (2015: S$18.8 billion). This comprised funded facilities of S$16.1 billion (2015: S$14.4 billion), including S$10.8 billion in committed facilities (2015: S$9.7 billion), and trade-related facilities of S$4.4 billion (2015: S$4.3 billion), including but not limited to bank guarantees, letters of credit, bid bonds and performance bonds. The increase over the previous year was mainly due to consolidation of Sembcorp Gayatri Power’s credit facilities following our increased stake in the company from 49% to 88% in 2016 and an increase in SFS’s multi-currency debt issuance programme limit from S$2 billion to S$2.5 billion in November 2016.
BORROWINGS
The Group aims to term out loans such that their maturity profile mirrors the operating life of our core assets, while continuing our focus on maintaining adequate liquidity for our businesses. We continue to build on our banking relationships to ensure that we are able to secure funding on competitive terms, as and when commercially viable and strategically attractive opportunities arise.
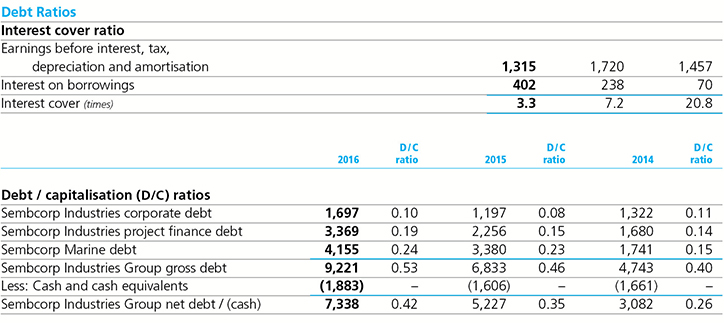
As at December 31, 2016, the Group’s gross borrowings amounted to S$9.2 billion (2015: S$6.8 billion). As compared to 2015, the increase of S$2.4 billion in gross borrowings was mainly due to the consolidation of Sembcorp Gayatri Power’s debt and new borrowings by Sembcorp Marine. The interest cover has also dropped from 7.2 times in 2015 to 3.3 times in 2016, mainly due to an increase in borrowings as well as greenfield projects that have not yet begun commercial operations. The Group remains committed to balancing the availability of funding and the cost of funding, while maintaining prudent financial ratios. We also aim to maintain an efficient and optimal mix of committed and uncommitted facilities.
Of the overall debt portfolio in 2016, 48% (2015: 66%) constituted fixed rate debt that was not exposed to interest rate fluctuations. The floating rate debt mainly comprised long-term bank loans in India to support the Group’s projects in the country. These bank loans are typically pegged to the respective lenders’ posted interest rates which are floating in nature. Currently, financial instruments that provide an effective hedge to movements in Indian rupee interest rates are not available in the domestic market. However, the Group’s floating rate borrowings in the country have benefited from the Reserve Bank of India’s reduction of interest rates in 2016. Should the right opportunity arise, the Group may consider issuing relatively shorter fixed rate bonds of up to seven years’ “sweet spot” tenor in the India debt market.
Financing and Treasury Highlights (S$ million)