|
|
|
|
 |
| |
 |
|
Sembcorp’s good performance in 2010 has
demonstrated the resilience of our strategy and
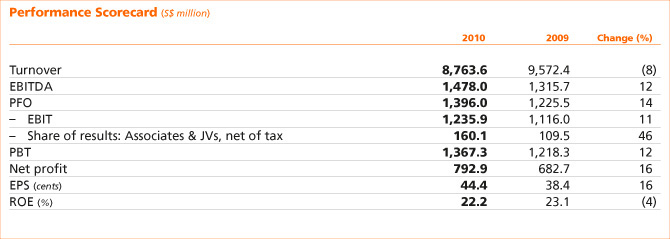
businesses. The Group’s net profit attributable to
shareholders of the Company (net profit) in 2010
grew by 16% to S$792.9 million, whilst turnover
was S$8.8 billion compared to S$9.6 billion in the
previous year.
During the year, the Group recorded an exceptional
gain of S$32.1 million comprising the Group’s share
of the Marine business’ full and final amicable
settlement of disputed foreign exchange transactions.
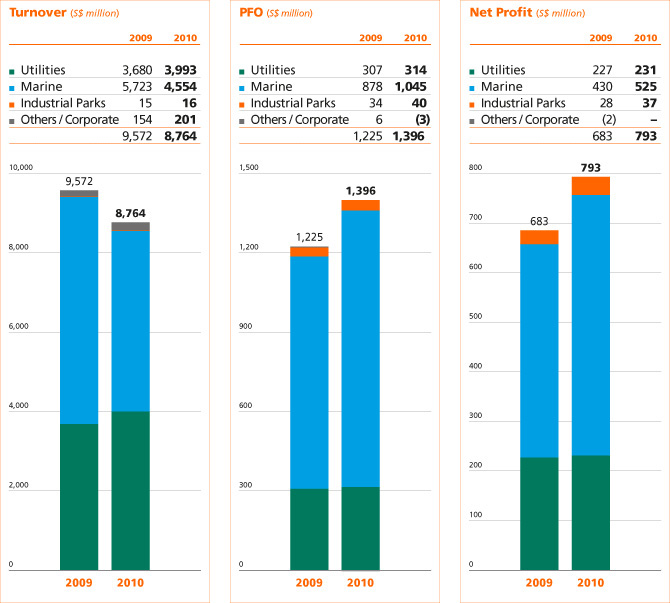
The Group achieved a turnover of S$8.8 billion,
with the Utilities and Marine businesses contributing
98% of total turnover.
The Utilities business’ turnover increased by 9%,
mainly due to higher high sulphur fuel oil (HSFO)
prices as well as the consolidation of Cascal’s turnover
with effect from July 2010.
The Marine business’ 2010 turnover decreased by
20% to S$4.6 billion mainly due to rig building as
well as offshore and conversion projects achieving a
lower percentage of completion revenue recognition
as compared to the prior year. There was also higher
variation order settlement for offshore contracts in
2009 as compared to 2010.
Revenue from the Others / Corporate segment
was mainly contributed by a subsidiary dealing
in specialised construction activities. The increase
in turnover in the segment compared to the year before was mainly due to differences in timing of the
recognition of revenue from projects.
The Group net profit in 2010 grew 16% from
S$682.7 million to S$792.9 million, while profit from
operations (PFO) increased 14% from S$1,225.5 million
to S$1,396.0 million.
The Utilities business’ net profit improved by 2% to
S$231.3 million. All regions registered growth except
for Teesside operations in the UK. Singapore operations
performed well, mainly driven by high electricity
prices and higher contribution from our natural gas
importation business. Outside Singapore, operations
in China and Middle East & Africa also registered
strong growth, increasing 226% and 80% respectively.
The performance of operations in Teesside, UK was
affected by lower volumes as a result of the previously
announced closure of some of its customers’ facilities,
low market spreads for power as well as the write-down
of certain ageing assets.
The increase in the Group’s share of the Marine
business’ 2010 net profit was mainly attributable to
the execution of projects ahead of schedule and the
achievement of better margins for the business’ rig
building, offshore and conversion projects through
higher productivity, as well as the resumption of
margin recognition for a rig building project upon
securing a buyer.
The Industrial Parks business’ higher net profit in
2010 was driven by healthy take-up for industrial,
commercial and residential land in its Vietnam industrial parks as well as improved contribution from
the business’ associate, Gallant Venture.
The exceptional item in 2010 relates to the Marine
business’ full and final amicable settlement of disputed
foreign exchange transactions. |
| |
 |
|
As at December 31, 2010, the Group had cash and
cash equivalents of S$3.5 billion.
Cash flows from operating activities before changes in working capital increased from S$1,355.6 million
in 2009 to S$1,440.2 million in 2010. Net cash inflow
from operating activities for 2010 increased to
S$1,702.4 million, mainly due to receipts from ongoing
and completed projects.
Net cash outflow from investing activities for 2010
was S$761.4 million. S$632.3 million was spent on
expansion and operational capital expenditure and
S$18.8 million was for equity interests in an associate
and joint ventures. S$197.0 million (net of cash acquired) was spent for the acquisition of a 92.26%
equity interest in Cascal and S$15.8 million for an
additional 5.4% equity interest in Cascal. The above
cash outflows were partially offset by dividends and
interest received of S$97.3 million.
The net cash outflow from financing activities
of S$29.5 million in 2010 related mainly to dividends
and interest paid, partially offset by net proceeds
from borrowings.
During the financial year, the Company issued
3,630,192 new ordinary shares amounting to
S$17.1 million for the acquisition of all remaining
shares in The China Water Company (CWC) not already
held by its municipal water subsidiary Cascal from
Waterloo Industrial, CWC’s only other shareholder.
Group shareholders’ funds increased from
S$3.3 billion at December 31, 2009 to S$3.8 billion
at December 31, 2010. The decrease in ’Other reserves’
was mainly due to foreign currency translation loss;
partially offset by fair value gain on Cosco Corporation
(Singapore) (Cosco) shares held by the Marine business.
Non-current assets, with the exception of
investment properties, increased primarily due to the
consolidation of Cascal. ’Interests in associates’ and
’Interests in joint ventures’ increased due to higher
contributions recorded in 2010. Intangible assets
include goodwill as well as intangible assets arising
from service concession agreements. ’Other financial
assets’ increased, mainly due to fair value adjustments
of Cosco shares held by the Marine business.
’Inventories and work-in-progress’ decreased
and ’Cash and cash equivalents’ increased, mainly
due to receipts from the Marine business’ completed
rig building projects. ’Assets held for sale’ mainly
relates to the disposal of property, plant and
equipment (PPE) by the Utilities business. ’Deferred tax
liabilities’ increased mainly due to the consolidation of
Cascal. Increase in ’Provisions’ was mainly due to higher
provision for restoration of PPE by the Marine business.
’Interest-bearing borrowings’ increased primarily due
to medium-term notes issued by the Group’s wholly-owned
treasury subsidiary, Sembcorp Financial Services
(SFS), increased bank borrowings for the acquisition
of Cascal and funding of Utilities operations, mainly in
Oman. The increase in ’Other long-term liabilities’ was
mainly due to an amount owed to a non-controlling interest of a subsidiary as well as the consolidation
of Cascal.
Return on equity (ROE) for the Group was a healthy
22.2% in 2010 and earnings per share (EPS) increased
to 44.4 cents.
Subject to approval by shareholders at the next
annual general meeting, a final tax exempt one-tier
dividend of 17.0 cents per ordinary share comprising a
final ordinary dividend of 15 cents per ordinary share
and a final bonus dividend of 2 cents per ordinary
share has been proposed for the financial year ended
December 31, 2010.
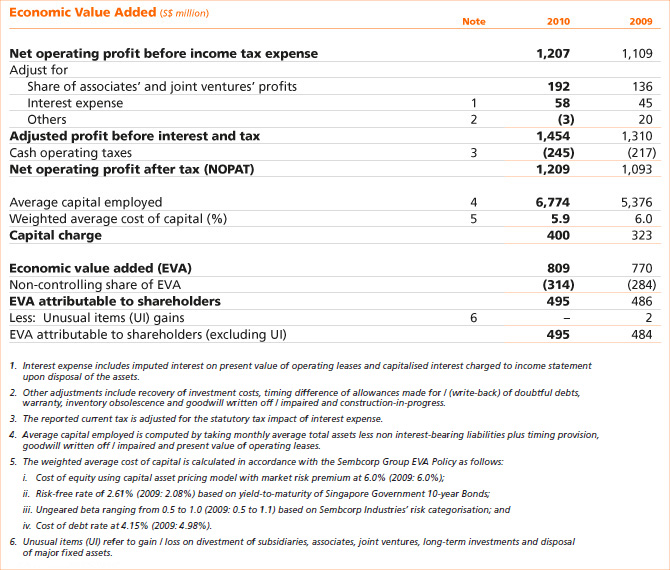
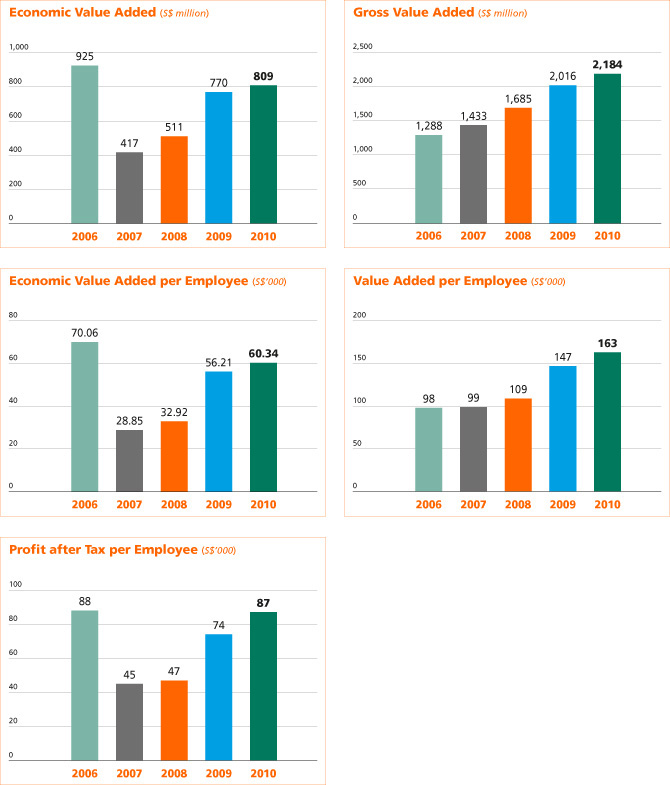
The Group generated positive economic value
added (EVA) of S$809.4 million in 2010. This positive
EVA creation was mainly driven by better Group earnings.
Our net operating profit after tax (NOPAT) for 2010
amounted to S$1.2 billion whilst capital charges increased
to S$399.6 million, mainly due to a higher capital base.
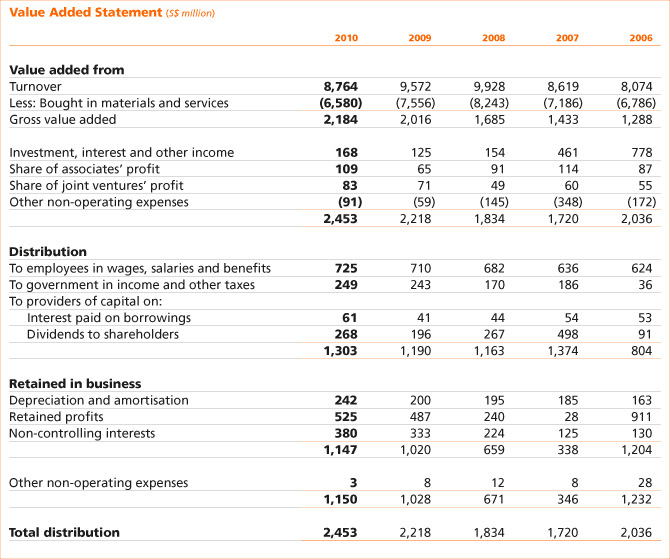
In 2010, the Group’s total value added was
S$2.5 billion. This was absorbed by employees
in wages, salaries and benefits of S$724.9 million,
by governments in income and other taxes of
S$248.6 million and by providers of capital in interest
and dividends of S$328.7 million, leaving a balance
of S$1.2 billion reinvested in business.
Sembcorp’s financial statements are prepared
in accordance with Singapore Financial Reporting
Standards (FRS).
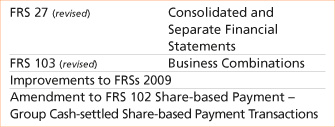
With effect from January 1, 2010, the Group adopted
the following new / amended FRS and Interpretations
of Financial Reporting Standards (INT FRS): |
| |
 |
| |
The adoption of the above FRS (including
consequential amendments) does not have any
significant impact on the Group’s financial statements,
except for the impact of FRS 103 and FRS 27 as
indicated below.
The revised FRS 103 introduces a number of
changes in accounting for business combinations
occurring after July 1, 2009. These changes will impact
the amount of goodwill recognised, the reported
results in the period that an acquisition occurs, and
future reported results. The Amendments to FRS 27
require that a change in the ownership interest of a subsidiary (without loss of control) is accounted
for as an equity transaction. Therefore, such
transactions will no longer give rise to goodwill,
nor will they give rise to a gain or loss. Furthermore,
the amended standard changes the accounting
for losses incurred by the subsidiary whereby
losses applicable to the non-controlling interests
in a subsidiary are allocated to the non-controlling
interests, even if doing so causes the non-controlling
interests to have a deficit balance. These changes
in the revised FRS 103 and Amendments to
FRS 27 will affect accounting for acquisitions or loss of control and transactions involving non-controlling
interests.
The Group’s activities expose it to a variety of
financial risks, including changes in interest rates,
foreign exchange rates and commodity prices as
well as credit risk.
Please refer to the Risk Management & Mitigation
Strategies chapter of this report for details on the
management of these risks.
Sembcorp’s financing and treasury activities
continue to be mainly centralised within our wholly-owned subsidiary Sembcorp Financial Services (SFS),
the Group’s Treasury vehicle. SFS facilitates funding
and on-lends funds borrowed by it to the companies
within the Group, where appropriate.
SFS also actively manages the cash within the
Group by taking in surplus funds from those with
excess cash and lending to those with funding
requirements. We actively manage the Group’s excess
cash, deploying it to a number of financial institutions
and actively tracking developments in the global
banking sector. Such proactive cash management continues to be an efficient and cost-effective way
of managing the Group’s cash and financing its
funding requirements.
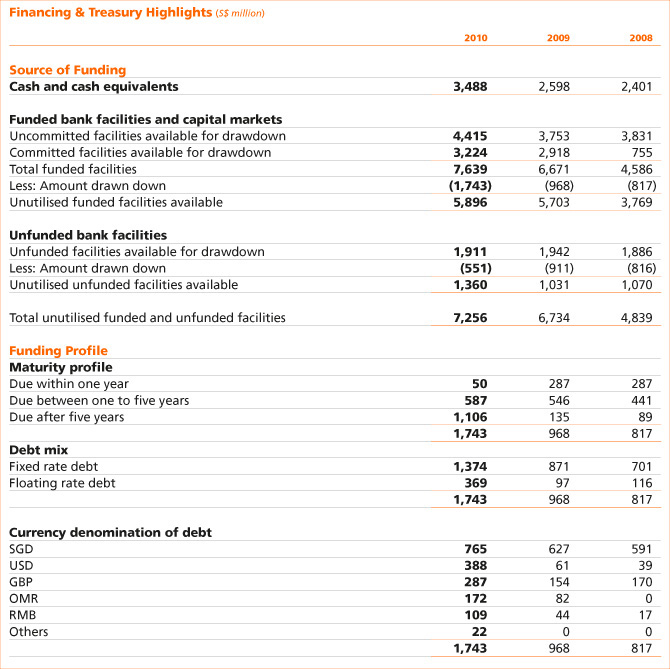
Including SFS’ S$1.5 billion and Sembcorp Marine’s
S$2 billion medium-term note programme, the Group’s
total funded facilities as at end 2010 amounted to
S$7.6 billion (2009: S$6.7 billion), with unfunded
facilities standing at S$1.9 billion (2009: S$1.9 billion).
While Europe and the USA have experienced a
slowdown in economic growth in the past year, Asia
has nonetheless continued to enjoy robust growth in
2010. Against this background, the market has seen
a substantial inflow of funds diverted towards Asia in
search of investment opportunities and high returns,
offering the Group the opportunity to tap funding
markets at a level almost comparable to the period
prior to the collapse of Lehman Brothers Holdings.
In 2010, the Group seized the opportunity to issue
a S$100 million 7-year note maturing in September
2017, a S$300 million 10-year note maturing in April
2020 and a S$100 million 15-year note maturing in
August 2025 under SFS’ S$1.5 billion medium-term
note programme. The Group aims to term out the
loans such that their maturity profile mirrors the life
of our core assets, while concurrently continuing
our focus on maintaining adequate liquidity for the
Group’s businesses.
We continue to build on our banking relationships
with a view to ensuring that when commercially viable
and strategically attractive opportunities arise, we are
able to secure funding on competitive terms.
The Group remains committed to balancing the
availability of funding and the cost of funding,
together with the need to maintain prudent financial
ratios. We also aim to maintain an efficient and optimal mix of committed and uncommitted facilities
and fixed and floating rate borrowings.
As at December 31, 2010, gross borrowings
amounted to S$1.7 billion (2009: S$967.7 million)
which was higher than last year. The incremental
borrowings were used to fund the Group’s new
projects and acquisitions. As the Group continues to
grow organically and inorganically, the Group will
also potentially tap new borrowings to fund its
growth. Of the overall debt portfolio, 79% (2009: 90%)
constituted fixed rate debts which were not exposed to
interest rate fluctuations.
The Group seeks to limit its interest rate exposure
by adopting a prudent debt structure, balancing this
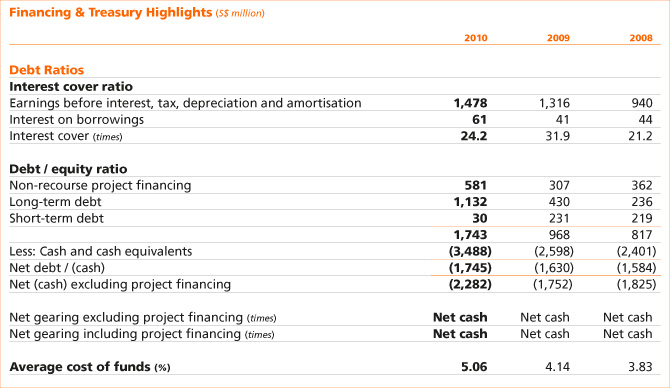
with liquidity and cost considerations. The weighted
average cost of funding was 5.06% (2009: 4.14%)
which was higher than previous year due to the
terming out of the loans. The interest cover ratio is
still in a very healthy range. With the increase in gross
debt, this ratio was reduced to 24.2 times in 2010 as
compared to 31.9 times in 2009.
As at end 2010, the portion of the Group’s debt
maturing beyond one year was 97% (2009: 70%). Only
S$50.1 million of the Group’s debt is due within 12 months. |
| |
|
|
|
|