|
|
|
|
 |
| |
 |
| |
|
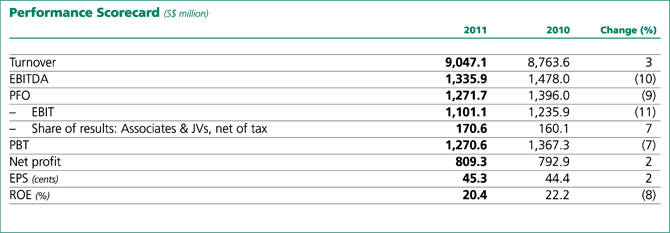
Sembcorp delivered a strong performance
in 2011. Our robust operating performance
demonstrated the strength of our businesses. The
Group’s net profit attributable to shareholders of
the company (net profit) in 2011 grew by 2% to
S$809.3 million, while turnover was up 3% from
S$8.8 billion in the previous year to S$9.0 billion.
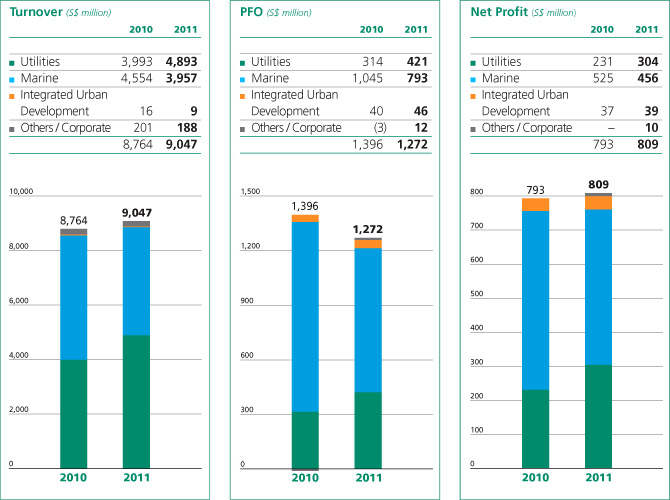
The Group achieved a turnover of S$9.0 billion,
with the Utilities and Marine businesses contributing
98% of total turnover.
The Utilities business’ turnover increased by
23%, mainly attributable to our Singapore operations
where part of the revenue was indexed to higher
High Sulphur Fuel Oil (HSFO) prices recorded during
the year. Furthermore, we started receiving our
second tranche of natural gas from West Natuna,
Indonesia, in November 2011, further boosting
revenue during the year.
The Marine business’ 2011 turnover decreased
by 13% to S$4.0 billion mainly due to lower revenue
recognition from rig building projects, as well as the
resumption of revenue recognition on delivery of
PetroRig III semi-submersible rig and the sale of a CJ-70 harsh environment jack-up rig in 2010. This was partially offset by higher revenue recognition from ship conversion and offshore projects.
Group net profit in 2011 grew 2% from
S$792.9 million to S$809.3 million, while profit
from operations was S$1,271.7 million compared
to S$1,396.0 million in the previous year.
Our Utilities business delivered robust profit
growth in 2011, with net profit growing 32%
to S$304.4 million. Record profits for the business
were driven by good operating performance in
Singapore, China and the Middle East & Africa.
Marine’s 2011 net profit contribution to the Group
was S$456.2 million compared to S$524.9 million
in 2010. The Marine business’ net profit was lower
mainly due to fewer jack-up and semi-submersible
rig projects. The Integrated Urban Development
business’ higher net profit in 2011 was primarily
due to higher land sales recognised. |
| |
 |
| |
|
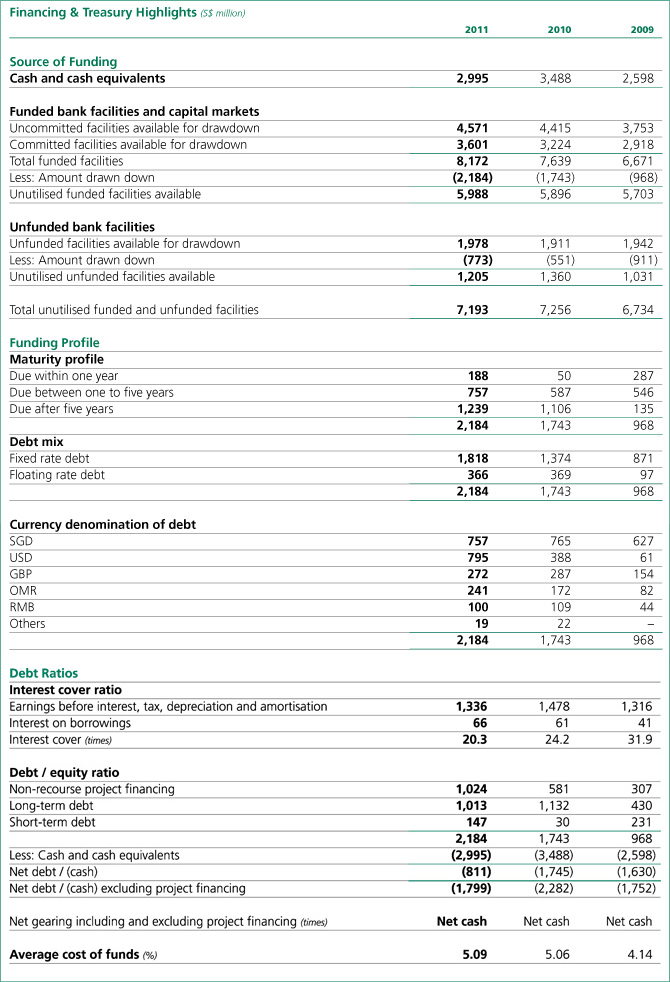
As at December 31, 2011, the Group’s cash
and cash equivalents stood at S$3.0 billion.
Cash flows from operating activities before
changes in working capital decreased from
S$1,440.2 million in 2010 to S$1,380.8 million
in 2011. Net cash inflow from operating
activities for 2011 was S$975.0 million compared
to S$1,702.4 million in 2010, mainly due to
Marine’s increase in working capital for the
ongoing projects.
Net cash outflow for investing activities for
2011 was S$1,142.9 million. S$1,090.2 million
was spent on purchase of property, plant and
equipment and payment for intangible assets and
S$197.6 million was used for equity interests into
associates and joint ventures. The above cash
outflows were partially offset by dividends and
interest received of S$140.4 million.
Net cash outflow from financing activities
for 2011 was S$323.5 million, mainly related
to dividends and interest paid and purchase of
treasury shares, partially offset by net proceeds
from borrowings.
Group shareholders’ funds increased from
S$3.8 billion as at December 31, 2010 to S$4.1 billion
as at December 31, 2011.
Non-current assets increased primarily due
to higher capital work-in-progress mainly for
Utilities and Marine projects. Trade and other
receivables and trade and other payables increased
in line with turnover. Tax recoverable decreased
mainly due to receipt of tax refunds from the
Inland Revenue Authority of Singapore. Cash and
cash equivalents decreased mainly as a result of
payment of dividends and funding for capital
expenditure. Interest-bearing borrowings increased
due to increased bank borrowings from the
drawdown of project finance debts.
Return on equity (ROE) for the Group was a
healthy 20.4% in 2011 and earnings per share (EPS)
increased to 45.3 cents.
Subject to approval by shareholders at the next
annual general meeting, a final tax exempt one-tier
dividend of 17.0 cents per ordinary share, comprising
an ordinary dividend of 15.0 cents and a bonus
dividend of 2.0 cents, has been proposed for the
financial year ended December 31, 2011.
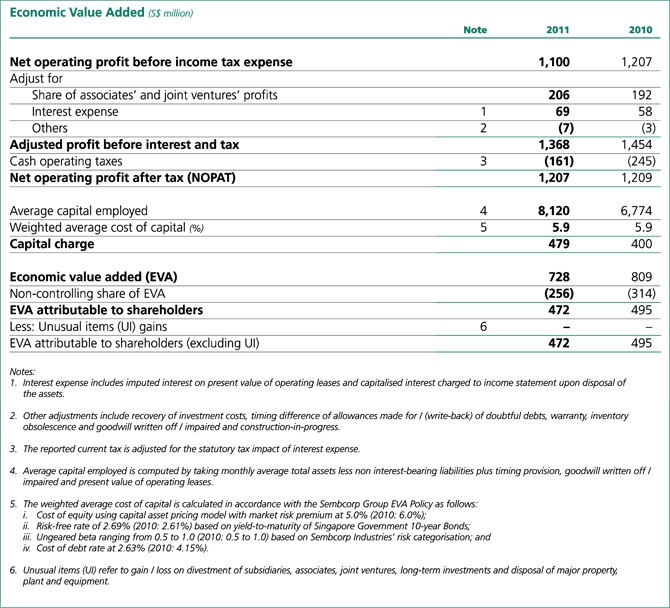
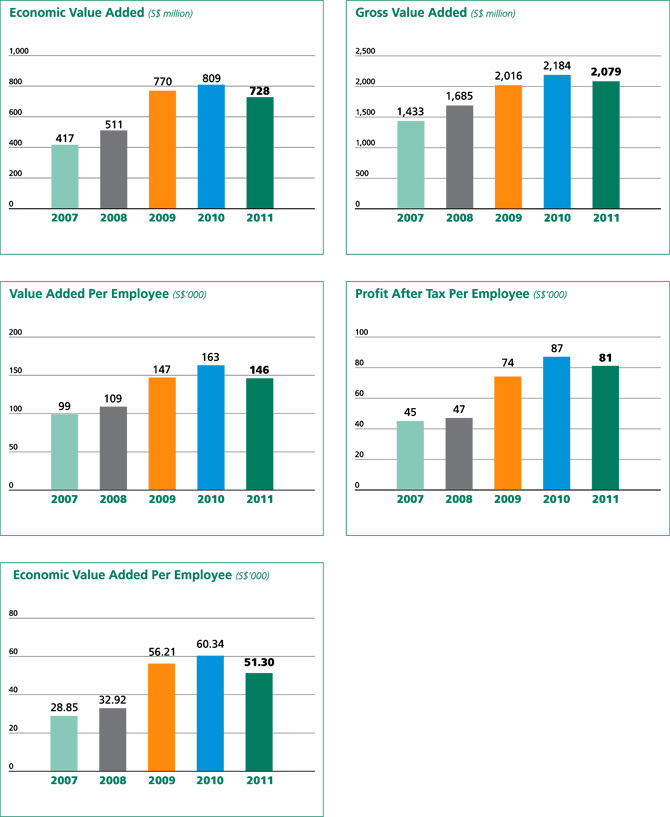
The Group generated positive economic value
added (EVA) of S$728.2 million in 2011.
Our net operating profit after tax for 2011
amounted to S$1.2 billion while capital charges
increased to S$479.1 million, mainly due to a
higher capital base.
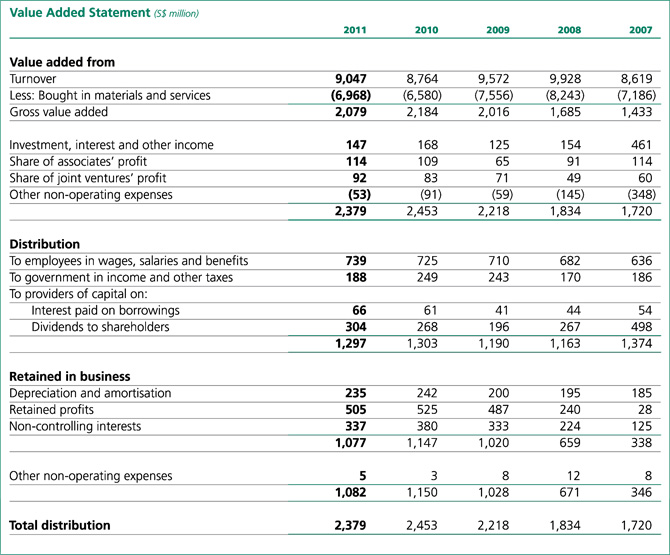
In 2011, the Group’s total value added was
S$2.4 billion. This was absorbed by employees
in wages, salaries and benefits of S$739.2 million,
by governments in income and other taxes of
S$188.3 million and by providers of capital in
interest and dividends of S$369.7 million, leaving
a balance of S$1.1 billion reinvested in business.
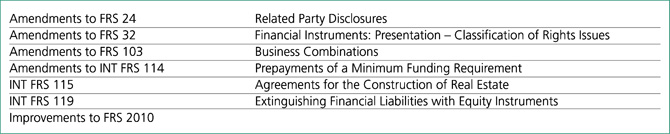
Sembcorp’s financial statements are prepared
in accordance with Singapore Financial Reporting
Standards (FRS).
With effect from January 1, 2011, the Group adopted
the following new / amended FRSs and Interpretations
of Financial Reporting Standards (INT FRS): |
| |
 |
| |
The adoption of the FRSs (including consequential
amendments) does not have any significant impact
on the Group’s financial statements.
The Group’s activities expose it to a variety
of financial risks, including changes in interest rates,
foreign exchange rates and commodity prices as
well as credit risk.
Please refer to the Risk Management & Mitigation
Strategies chapter of this report for details on the
management of these risks.
Sembcorp’s financing and treasury activities
continue to be mainly centralised within our wholly-owned
subsidiary, Sembcorp Financial Services (SFS),
the Group’s Treasury vehicle. SFS facilitates funding
and on-lends funds borrowed by it to the businesses
within the Group, where appropriate.
SFS also actively manages the cash within the
Group by taking in surplus funds from businesses
with excess cash and lending to those with funding
requirements. We actively manage the Group’s excess
cash, deploying it to a number of financial
institutions, and actively track developments in the
global banking sector. Such proactive cash
management continues to be an efficient and
cost-effective way of managing the Group’s cash
and financing its funding requirements.
Including SFS’ S$1.5 billion and Sembcorp
Marine’s S$2.0 billion medium-term note programme,
the Group’s total funded facilities as at end 2011 amounted to S$8.2 billion (2010: S$7.6 billion),
with unfunded facilities standing at S$2.0 billion
(2010: S$1.9 billion).
In 2011, SFS signed a S$520.0 million bank
loan comprising a S$230.0 million loan maturing
in September 2017 and a S$290.0 million loan
maturing in September 2020. The Group aims to
term out the loans such that their maturity profile
mirrors the life of our core assets, while we continue
our focus on maintaining adequate liquidity for the
Group’s businesses.
We continue to build on our banking
relationships to ensure that we are able to secure
funding on competitive terms as and when
commercially viable and strategically attractive
opportunities arise.
The Group remains committed to balancing
the availability of funding and the cost of funding,
together with the need to maintain prudent financial
ratios. We also aim to maintain an efficient and
optimal mix of committed and uncommitted facilities
and fixed and floating rate borrowings. Of the
overall debt portfolio, 83% (2010: 79%) constituted
fixed rate debts which were not exposed to interest
rate fluctuations.
As at December 31, 2011, gross borrowings
amounted to S$2.2 billion (2010: S$1.7 billion)
which was higher than last year. The incremental
borrowings were mainly due to drawdown of project
finance loans, which were funded at relatively higher
interest rates, to fund the construction of our power
and water plant in Oman. As a result, Group
borrowings and interest expense were slightly higher
in 2011 as compared to 2010. The weighted average
cost of funding in 2011 was 5.09% (2010: 5.06%)
while the interest cover ratio remained in a healthy
range of 20.3 times in 2011 (2010: 24.2 times). The
lower interest cover ratio in 2011 was due to the
combination of lower EBITDA and slightly higher
interest expense as compared to 2010.
As the Group strives to grow, the Group’s interest
expense is expected to increase along with higher
borrowings to fund its growth strategy.
|
| |
|
|
|
|