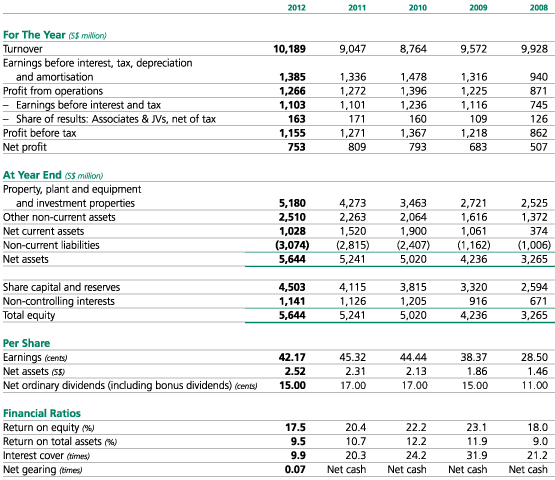
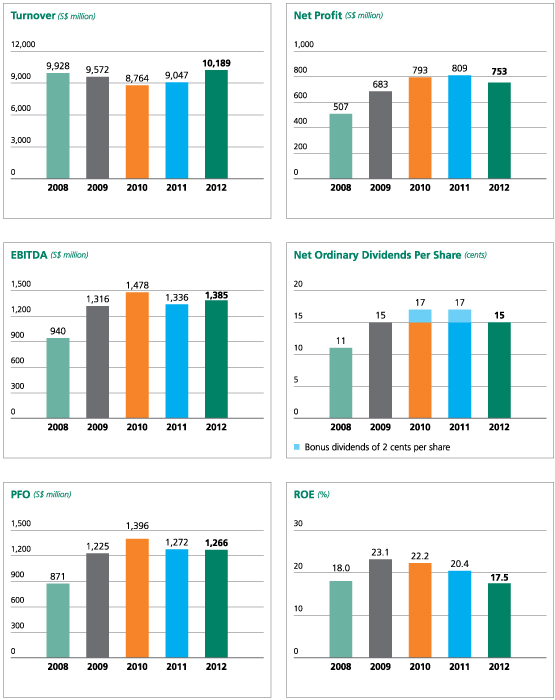
Sembcorp reported a net profit
of S$753.3 million for the full
year 2012, compared to S$809.3
million in 2011. Turnover grew
13% to S$10.2 billion from
S$9.0 billion in the previous year.
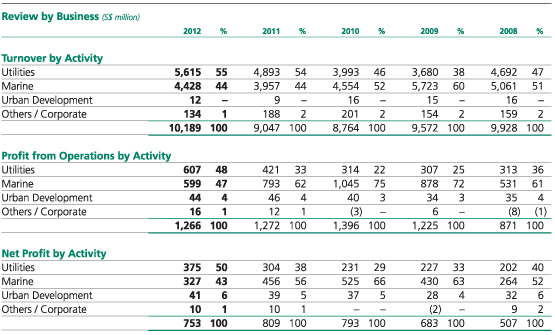
In 2012, our Utilities business
achieved record profits of
S$374.6 million, growing
23% from S$304.4 million in
2011. This was due to better
performance from our Singapore
operations, attributable to
additional gas sales during
the year.
Our Marine business
contributed S$326.7 million
in net profit for the year. The
business achieved a record net
orderbook of S$13.6 billion
as at February 2013, with
completion and deliveries
stretching into 2019.
Earnings per share for the
Group amounted to 42.2 cents
for the year and return on equity
was a healthy 17.5%.
Sembcorp delivered a strong
performance in 2011. Net profit
for the full year grew 2% from
S$792.9 million in 2010 to
S$809.3 million, while turnover
was up 3% from S$8.8 billion in
the previous year to S$9.0 billion.
Our main profit contributors
continued to be our Utilities
and Marine businesses, which
collectively accounted for 92%
of Group net profit. Our Utilities
business delivered robust profit
growth in 2011, with net profit
growing 32% to S$304.4 million.
Record profits for the business
were driven by good operating
performance in Singapore,
China and the Middle East &
Africa. The Marine business
contribution to net profit was
13% lower at S$456.2 million
mainly due to fewer jack-up and
semi-submersible rig projects.
This was offset by the higher
interest income received in 2011
for deferred payment granted to
customers and write-back of prior
years tax over-provisions.
Sembcorps net profit for the year
grew 16% from S$682.7 million
to S$792.9 million, while turnover
was S$8.8 billion compared to
S$9.6 billion in 2009.
The Utilities business net
profit improved by 2% to
S$231.3 million with all regions
registering growth except for
operations in Teesside, UK,
while the Marine business
contribution to net profit grew
22% to S$524.9 million.
During the year, the Group
recorded an exceptional gain
of S$32.1 million comprising
the Groups share of the Marine
business full and final amicable
settlement of disputed foreign
exchange transactions.
Sembcorps net profit for the
year grew 35% from S$507.1
million to S$682.7 million, while
turnover stood at S$9.6 billion.
The Marine business
contribution to net profit grew
63% from S$263.7 million to
S$430.2 million, attributable to
a combination of operational
efficiency and execution of
projects ahead of schedule
resulting in better margins
and the resumption of margin
recognition for some of the
business projects. The Utilities
business net profit grew by
12% from S$202.4 million to
S$226.7 million, with operations
in Singapore, China, Vietnam and
the UAE showing growth.
Sembcorps turnover increased
by 15% from S$8.6 billion to
S$9.9 billion. Net profit for the
year stood at S$507.1 million.
Excluding the one-off write-back
of S$48.0 million of tax provisions
recorded in 2007, Sembcorp
achieved a net profit growth
of 6%.
The Marine business
contribution to net profit
rose 75% to S$263.7 million,
mainly due to higher revenue
and operating margins from
its rig building and ship
repair businesses. The Utilities
business net profit stood at
S$202.4 million mainly due to
contributions from our Singapore
and UK operations.
During the year, the Group
recorded an exceptional loss of
S$26.9 million comprising the
Groups share of the Marine
business foreign exchange losses
from unauthorised transactions.
|