|
|
|
 Email this page / Email this page /  Bookmark this page / Bookmark this page /  Download print-friendly PDF Download print-friendly PDF |

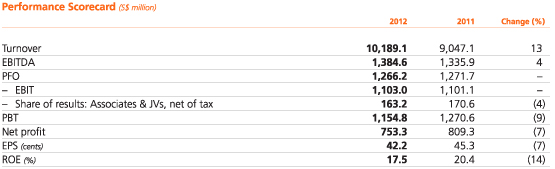
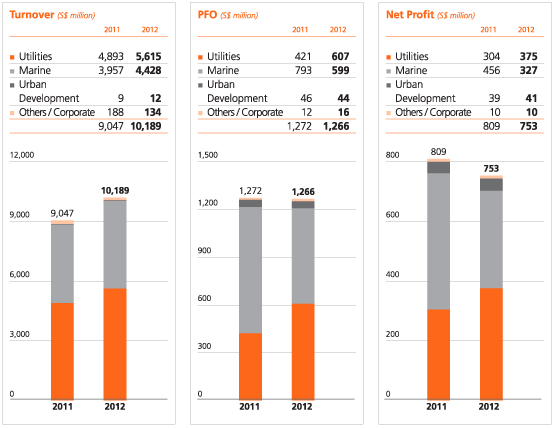
Sembcorp reported a net profit of S$753.3 million for the full year 2012, compared to S$809.3 million in 2011. Turnover grew 13% to S$10.2 billion from S$9.0 billion in the previous year. The Utilities and Marine businesses continued to be our main profit contributors, accounting for 48% and 42% of Group net profit respectively.
The Group achieved a turnover of S$10.2 billion, with the Utilities and Marine businesses contributing 99% of total turnover.
The Utilities business turnover increased by 15% to S$5.6 billion, mainly attributable to growth from our Singapore operations, driven primarily by additional gas sales following the delivery of a further 90 billion British thermal units per day of natural gas imported from Indonesias West Natuna Sea, which started in November 2011. The business turnover in 2012 increased also due to higher turnover contribution from the Middle East upon commencement of full operation of our Salalah Independent Water and Power Plant in Oman in May 2012.
The Marine business 2012 turnover increased by 12% to S$4.4 billion mainly due to the higher revenue recognition for rig building and offshore platform projects.
The Group recorded a net profit of S$753.3 million in 2012 compared to net profit of S$809.3 million in 2011, while profit from operations was S$1,266.2 million compared to S$1,271.7 million in the previous year.
In 2012, our Utilities business achieved record profits of S$374.6 million, growing 23% from S$304.4 million in 2011. While Singapore operations remained the business largest profit contributor, contribution from our overseas operations also grew with China, Vietnam, Australia and the Middle East delivering an improved performance over 2011.
Meanwhile, our Marine business contributed S$326.7 million in net profit compared to S$456.2 million in 2011, due to lower margin from new design rigs and resumption of margin recognition on completion and delivery of the Songa Eclipse semi-submersible rig in 2011.
As at December 31, 2012, the Groups cash and cash equivalents stood at S$2.1 billion.
Cash flows from operating activities before changes in working capital increased from S$1,380.8 million in 2011 to S$1,418.9 million in 2012. Net cash inflow from operating activities for 2012 was S$620.4 million compared to S$913.4 million in 2011 mainly due to increase in working capital and a tax refund from Inland Revenue Authority of Singapore in 2011.
Net cash outflow from investing activities for 2012 was S$1,229.9 million. S$1,129.9 million was spent on the purchase of property, plant and equipment and payment for intangible assets and S$203.6 million on the acquisition of non-controlling interests, new and additional investments in a subsidiary, associates and joint ventures as well as investment in a long-term fund. The above cash outflows were partially offset by dividends, interests and proceeds from sale of assets received amounting to S$103.6 million.
Net cash outflow from financing activities of S$309.6 million for 2012 was mainly related to dividends paid, partially offset by net proceeds from borrowings.
Group shareholders funds increased to S$4.5 billion as at December 31, 2012 from S$4.1 billion as at December 31, 2011.
Non-current assets increased primarily due to higher capital work-in-progress mainly for Utilities and Marine projects. Interests in associates and joint ventures increased mainly due to the Utilities business acquisition of power assets in China and the Urban Development business new investment in Chengdu and higher share of profits contributed by its associates and joint ventures during the year. Inventories and work-in-progress increased primarily due to payment terms of rig building projects. Cash and cash equivalents decreased mainly as a result of payment of dividends to shareholders and the Marine business increase in working capital for ongoing projects. Excess of progress billings over work-in-progress increased significantly mainly due to receipts from customers for rig building projects-in-progress. Interest-bearing borrowings increased due to higher bank borrowings mainly to fund the Marine business capital expenditures and the construction of our new cogeneration plant in Singapore, as well as from the drawdown of project financing debts.
Return on equity (ROE) for the Group was 17.5% and earnings per share (EPS) amounted to 42.2 cents in 2012.
Subject to approval by shareholders at the next annual general meeting, a final ordinary one-tier tax exempt dividend of 15.0 cents per share has been proposed for the financial year ended December 31, 2012.
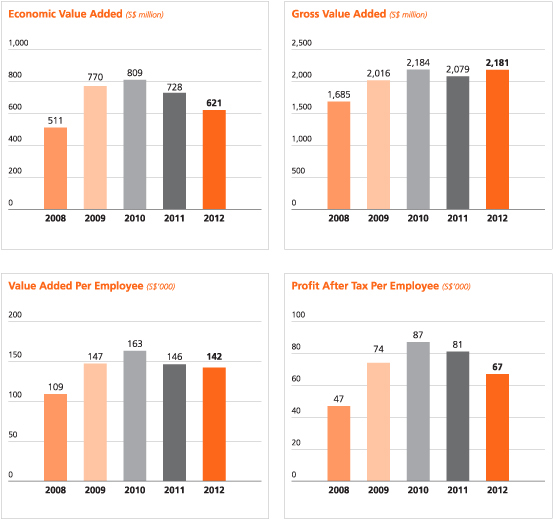
The Group generated positive economic value added (EVA) of S$620.7 million in 2012.
Our net operating profit after tax for 2012 amounted to S$1.1 billion while capital charges increased to S$523.6 million, mainly due to a higher capital base.
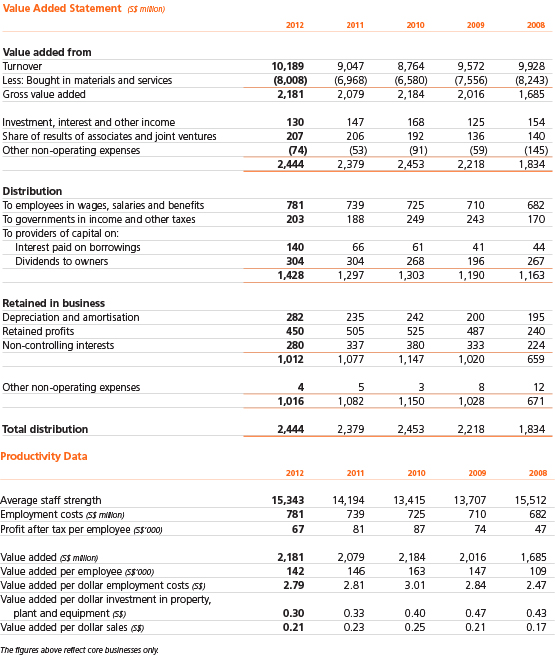
In 2012, the Groups total value added was S$2.4 billion. This was absorbed by employees in wages, salaries and benefits of S$781.1 million, by governments in income and other taxes of S$203.3 million and by providers of capital in interest and dividends of S$443.6 million, leaving a balance of S$1.0 billion reinvested in business.
Sembcorps financial statements are prepared in accordance with the Singapore Financial Reporting Standards (FRS).
With effect from January 1, 2012, the Group adopted the following new / amended FRSs:
The adoption of the above FRSs (including consequential amendments) does not have any significant impact on the Groups financial statements.
The Groups activities expose it to a variety of financial risks, including changes in interest rates, foreign exchange rates and commodity prices as well as credit risk.
Please refer to the Risk Management & Mitigation Strategies section of this annual report for details on the management of these risks.
Sembcorps financing and treasury activities continue to be mainly centralised within our wholly-owned subsidiary, Sembcorp Financial Services (SFS), the Groups Treasury vehicle. SFS facilitates funding and on-lends funds borrowed by it to the businesses within the Group.
SFS also actively manages the cash within the Group by taking in surplus funds from businesses with excess cash and lending to those with funding requirements. We actively manage the Groups excess cash, deploying it to a number of financial institutions, and actively track developments in the global banking sector. Such proactive cash management continues to be an efficient and cost-effective way of managing the Groups cash and financing its funding requirements.
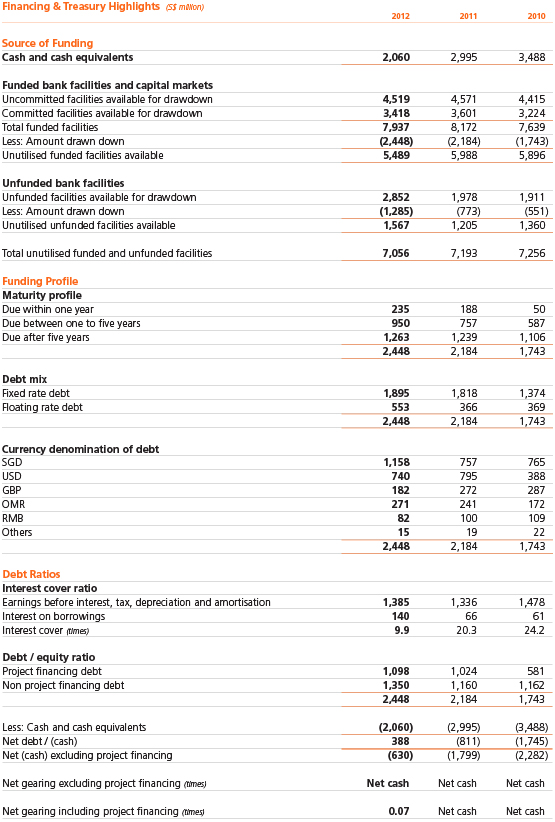
Including SFS S$1.5 billion and Sembcorp Marines S$2.0 billion medium-term note programme, the Groups total funded facilities as at end 2012 amounted to S$7.9 billion (2011: S$8.2 billion), with unfunded facilities standing at S$2.9 billion (2011: S$2.0 billion).
As at December 31, 2012, the Groups gross borrowings amounted to S$2.4 billion (2011:
S$2.2 billion) which was marginally higher than last year. The incremental borrowings were mainly due to a partial drawdown from the S$520.0 million loan facility that was signed in 2011 and drawdown of loans by Sembcorp Marine for its Singapore new yard.
The Group aims to term out the loans such that their maturity profile mirrors the life of our core assets, while we continue our focus on maintaining adequate liquidity for the Groups businesses. We continue to build on our banking relationships to ensure that we are able to secure funding on competitive terms as and when commercially viable and strategically attractive opportunities arise.
The Group remains committed to balancing the availability of funding and the cost of funding, together with the need to maintain prudent financial ratios. We also aim to maintain an efficient and optimal mix of committed and uncommitted facilities and fixed and floating rate borrowings. Of the overall debt portfolio, 77% (2011: 83%) constituted fixed rate debts which were not exposed to interest rate fluctuations.
As the Group continues to grow, the Group interest expense also increased during 2012 mainly due to our greenfield project in Oman which commenced full commercial operation in May 2012. Prior to May 2012, the interest expense related to the Oman project was capitalised.
|
|
|
|