In the context of constantly evolving requirements
of disclosure, transparency and corporate
governance, we aim to provide investors with
an accurate, coherent and balanced account of
the Group’s performance. To do this, multiple
communication platforms are utilised including
group briefings to analysts, investors and the
media; one-on-one meetings with shareholders
and potential investors; investor roadshows and the
investor relations section of our corporate website.
In addition, company visits and facility tours are
organised to help investors gain better insight
into the Group’s operations.
During the year, senior management and the
investor relations team continued to actively
maintain open communication channels with the
financial community. We held over 160 one-on-one
and group meetings with shareholders, analysts
and potential investors. These included non-deal
roadshows in major international financial centres.
In Asia, we covered Singapore and Hong Kong; in
Europe, Frankfurt, London, Geneva and Zurich; and
in North America, New York, Boston and Toronto.
We also participated in five investor conferences
in Singapore during the year: the Deutsche Bank
Access Asia Conference, HSBC Annual ASEAN
Conference and CIMB ASEAN Series in May,
the CLSA ASEAN Access Day in June, and the
Macquarie ASEAN Conference in August. We
also organised site visits to our Utilities operations
on Jurong Island to provide analysts and investors
a better understanding of our capabilities in
energy and water.
In June 2012, our Group President & CEO Tang
Kin Fei was ranked third for Best CEO and our Group
CFO Koh Chiap Khiong was ranked second for Best
CFO in Institutional Investor magazine’s 2012 All-Asia Executive Team. They were both nominated by
buy-side portfolio managers and analysts under the
conglomerates sector. The All-Asia Executive Team
is a survey that identifies the top CEOs, CFOs and
investor relations professionals and teams in Asia
(ex-Japan) in relation to the quality of a company’s
investor relations programme.
In terms of corporate governance and
sustainability, Sembcorp improved its ranking from
eleventh to fourth in Singapore’s Governance
and Transparency Index 2012. Jointly launched
by The Business Times and the NUS Business
School’s Centre for Governance, Institutions and
Organisations, the index assesses the transparency
of 674 listed companies’ financial disclosures as
well as governance, ethics and rigour in financial
reporting. In addition, Sembcorp was again
selected as an index component of the Dow Jones
Sustainability Index (DJSI) Asia Pacific, for the
second year running. The index represents the top
20% in terms of sustainability out of the largest
600 companies in the developed Asia Pacific region.
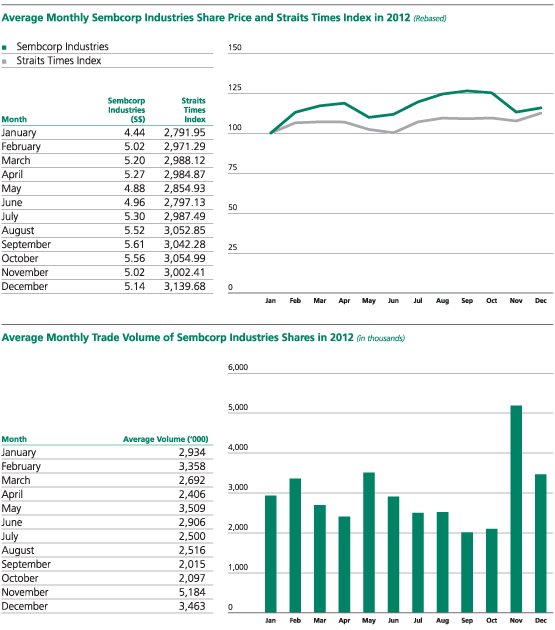
Sembcorp Industries’ share price closed the year at
S$5.25 with a market capitalisation of S$9.4 billion.
The company’s share price averaged S$5.16 during
the year, registering a low of S$4.11 on January 5,
2012 and a high of S$5.76 on October 2, 2012.
Daily turnover in 2012 averaged 3.0 million shares.
In May 2012, we paid out a final tax exempt
one-tier dividend of 17 cents per ordinary share, comprising a final ordinary dividend of 15 cents
per ordinary share and a final bonus dividend of
2 cents per ordinary share. For the year, Sembcorp
Industries shares delivered a total shareholder
return of 30%, outperforming the Straits Times
Index’s 21% and MSCI Asia Pacific ex-Japan
Industrial Index’s 9%.
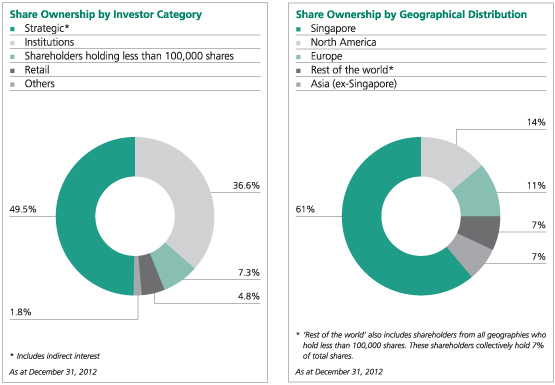
In 2012, other than our major shareholder Temasek
Holdings, which held 49.5% of our shares as at the
end of 2012, institutional shareholders as a group
continued to dominate Sembcorp’s shareholder base.

Institutional shareholders accounted for
36.6% of our issued share capital or 72.4% of free
float. Retail shareholders, shareholders holding
less than 100,000 shares, and others held the
remaining 13.9% of issued share capital or 27.6%
of free float. In terms of geographical breakdown,
excluding the stake held by Temasek Holdings,
Singapore shareholders accounted for 11% of
issued share capital. Our largest geographical
shareholding base was North America with 14%
of issued share capital. Shareholders from Europe
and Asia excluding Singapore accounted for 11%
and 7% of issued share capital respectively.

|